Research report
The Sensory Storytelling ROI Report An exploration of return on investment in live brand experience
Based on primary research with industry experts, real-world brand activations, and published industry data, this framework helps brands calculate the potential ROI of experiential marketing before committing budget.
- $139B global experimental marketing spend in 2025
- 34× more effective: Face-to-face requests compared to email requests
- 95% of attendees trust a brand more after an in-person event
- 1.4–4.5× modeled return across six revenue streams
About This Report
The question, why it is worth investigating, and how this research approached it.
The question
How do you calculate the return on investment of a live brand experience?
It is among the most frequently asked questions in marketing, and among the most interesting, because it resists the methods that work elsewhere. A digital campaign can be traced from impression to click to purchase. A direct mail piece carries a code. A price promotion produces a measurable spike.
An event produces something different. A person stood in a space, handled a product, spoke to someone, and left with an impression that may influence a decision weeks or months later, through a path that no system currently observes end to end.
The difficulty is real, and it comes from the nature of live experience itself. Three characteristics in particular make the question a demanding one.
The first is that the effects operate on memory. A well-designed experience is intended to be remembered, and a person who remembers it may act on that weeks or months later. Section 07 establishes that this is how experience works, so measurement has to be designed around the delay.
The second is that the value is distributed across several different kinds of outcome. An activation can generate immediate leads, extended reach through what attendees share, and a durable shift in how a brand is regarded. All three outcomes are real, and all three are different from one another. Treating them as one undifferentiated benefit gives equal weight to outcomes that work in different ways and over different timescales, so this report prices each of them separately before adding them together.
The third is that the information required to answer the question sits in more than one organization. The party that designs and delivers an experience observes what happened inside it in considerable detail. The party that holds the commercial outcome is usually a different organization entirely. Section 06 examines this in full, and the structure it describes is the central reason the question has proved difficult to close out.
This report is an attempt to make progress on the calculation of the return on investment of a live brand experience, using published rates where they exist and working estimates where they do not. The aim is to establish what can be calculated with confidence, what can be estimated with stated assumptions, and what is currently unmeasured but measurable, and then to assemble those into a return a brand can calculate for itself before committing budget rather than after the fact.
Three conditions make this timely
There are three conditions that make this a useful moment to examine this question. Each is set out below, and each bears on how the question should be approached.
First, investment in live experience is growing, and consumer demand for it is growing faster than demand for most other discretionary categories. Sections 01 and 02 set out the evidence on both. Consumers are shifting spending toward experiences and away from goods, and that preference appears to strengthen rather than weaken when household budgets tighten. For a brand, this means the audience is there and is receptive. It also means more brands are competing for the same attention, and the quality of the reasoning behind an investment decision matters more when a category is busy than when it is quiet.
Second, the cost of appearing at events has risen sharply, and much of that increase is hidden from the event participants. Material handling, labor and electrical provision are contracted through venues rather than bought in an open market, and audited survey data shows several of these rates rising far faster than general inflation. Section 04 sets out the figures. When a larger share of a budget is consumed before the experience itself is designed, understanding what the remaining spend returns becomes more valuable.
The third condition is the most encouraging. The technology now deployed in most activations already captures far more information than is currently put to use. Interactive installations record which activity a visitor took part in, what they viewed and how they moved through an experience as a by-product of simply operating that experience. Section 12 examines what exists today and what it would take to connect it to commercial outcomes.
How the research was conducted
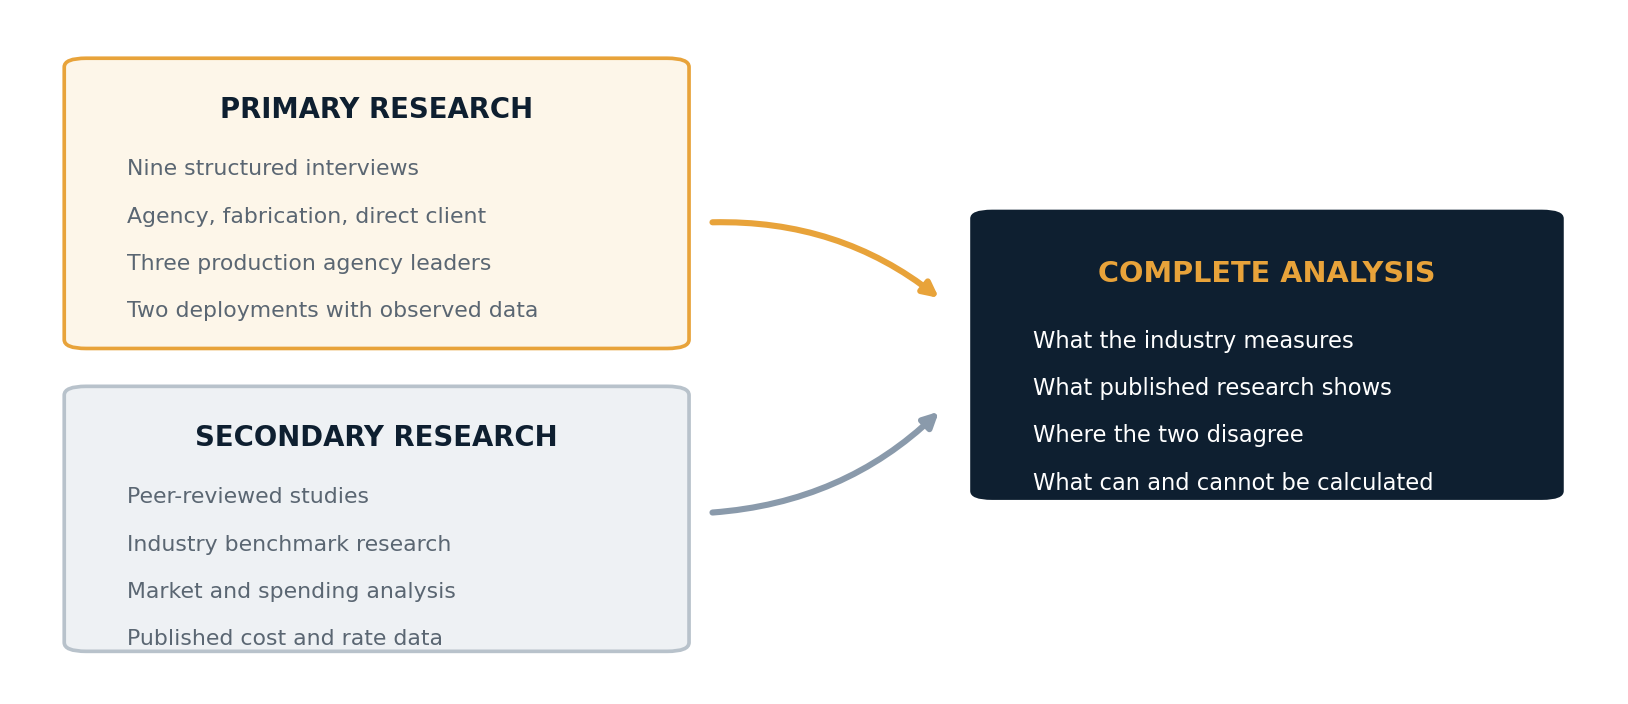
The report combines primary research with published third-party research, and each different research method combines to answer different parts of the question.
Interviews establish how the question is approached in practice: what practitioners measure, what their clients ask for, how decisions are made and where the information runs out.
Published research supplies what a set of conversations cannot: tested findings from controlled studies, benchmarks drawn from large samples, market data gathered independently of the events industry, and the prices of the alternatives against which an activation should be judged.
Used together, they allow the report to distinguish between what is established, what is common practice, and where the two do not match. Where practitioner accounts and published evidence agree, the finding is reported with confidence. Where they differ, both are set out and the difference is examined.
Ten interviews, across both sides of the transaction
Ten structured interviews were conducted in July 2026 with senior practitioners across the industry, each running approximately forty minutes and following a common guide covering market conditions, evaluation practice, specific deployments and outlook.
Four participants are agency intermediaries who commission and deliver activations on behalf of brands, working across sports, entertainment, financial services and retail. One is the owner of a custom fabrication business who builds for championship and concert events. One is a direct client running a national annual conference. Another is an event manager for a major tire manufacturer in the auto industry. Three are senior leaders at an integrated audiovisual and experiential agency, covering production, technology and business development.
The interviews cover both sides of the transaction. They include parties who commission work and parties who deliver it, and one organization that both incurs the cost of an event and receives its revenue, which is an unusual and valuable vantage point. Where accounts converge across positions that have no particular reason to agree, the finding is treated as robust. Where they diverge, both accounts are reported and the divergence is examined rather than resolved.
Two live projects also provided real operating data, rather than people recalling what happened. The first is a permanent installation that ran for nine months, which recorded how many people came through the door, how many took part, how many came back, what media coverage it generated, and what the staff working there observed day to day. The second is an annual membership conference, which provided attendance, cost and member retention figures held by the organization that runs it.
Five bodies of published work
The published research draws on five distinct bodies of work, each addressing a different part of the question.
Peer-reviewed marketing science and consumer psychology establishes the mechanisms. This includes the foundational literature on experience as a distinct economic offering and on experiential marketing as a discipline, together with validated instruments for measuring brand experience and its relationship to loyalty.
It also includes behavioral research on how people evaluate and remember experiences, among it a substantial meta-analytic literature on the peak-end effect; sensory research on how sight, sound, scent and touch affect recall and judgment; and field-experimental work on product sampling that traces effects on purchasing over a twelve-month horizon.
Meta-analytic reviews establish what is generalizable rather than particular to a certain environment or study. Two meta-analyses of sponsorship effectiveness, published a decade apart, cover the relationship between sponsorship and cognitive, affective and behavioral outcomes. Three meta-analyses of electronic word of mouth, covering more than 1,500 effect sizes between them, establish the size of the relationship between social activity and sales. These are used in preference to individual studies wherever both were available.
Industry benchmark research adds a further layer of input alongside the interviews, drawn from far larger samples than a set of conversations can provide. This includes annual exhibition industry indices, an independently audited survey of exhibition service rates across 23 United States cities, a global survey of 466 exhibition organizers across 59 countries, and the principal annual benchmark study of event marketers and attendees. Industry-sponsored research is used where the sample and method are disclosed, and is identified as industry-sponsored wherever it appears.
Consumer and market data establishes demand conditions from outside the events industry, which limits the risk of circular reasoning. This includes consumer spending analysis, aggregated card transaction data, published quarterly results from the largest operator in live entertainment, and multi-market consumer trend research.
Published cost and pricing data supplies the comparators the model requires: media rates by format, customer acquisition costs by category, influencer rates by tier, and the cost of formal measurement itself.
Read together with the interviews, these sources establish not only what practitioners do but why, what the wider evidence supports, and where the two align or differ. Both are necessary for a robust report. The interviews describe practice that no published source records. The published research supplies the tested findings, the benchmarks and the prices that no single set of conversations could provide.
How the report is organized
The report follows the shape of the question. It begins with the conditions a brand is investing into, moves through the sequence an activation actually runs, and closes with what to establish before committing budget.
Part one: The conditions
Before the return on an activation can be assessed, it helps to understand the market it sits in, what the audience wants, what the published evidence already establishes, and what is happening to costs. Sections 01 to 05 cover that ground.
| Section | The question it addresses | What it draws on |
|---|---|---|
| 01. Market size and growth | Is this category expanding, and does published data agree with what practitioners report? | Market forecasts, exhibition indices, global organizer survey, interviews |
| 02. Consumer demand | What is happening to the appetite for live experience, and how do we know? | Consumer spending analysis, card transaction data, public company results, trend research |
| 03. What the evidence says events produce | What has actually been established about the effects of live experience? | Peer-reviewed studies, meta-analyses, field experiments, benchmark surveys |
| 04. Activity outside the official footprint | What is happening to the cost of appearing, and how are brands responding? | Audited rate survey, exhibitor research, cost frameworks, interviews |
| 05. Competition and choice | How do brands pick which events to attend, how do audiences pick, and why does competition push budgets up? | Attendance and selection research, industry surveys, effectiveness literature, interviews |
Part two: The measurement chain
Every activation runs through the same sequence, from money committed through exposure, participation, engagement and capture, to conversion, customer value and return. Each stage is measured by different organizations in the process, but the stages are not all measured by the same organization, and that division is the structural feature this part examines.
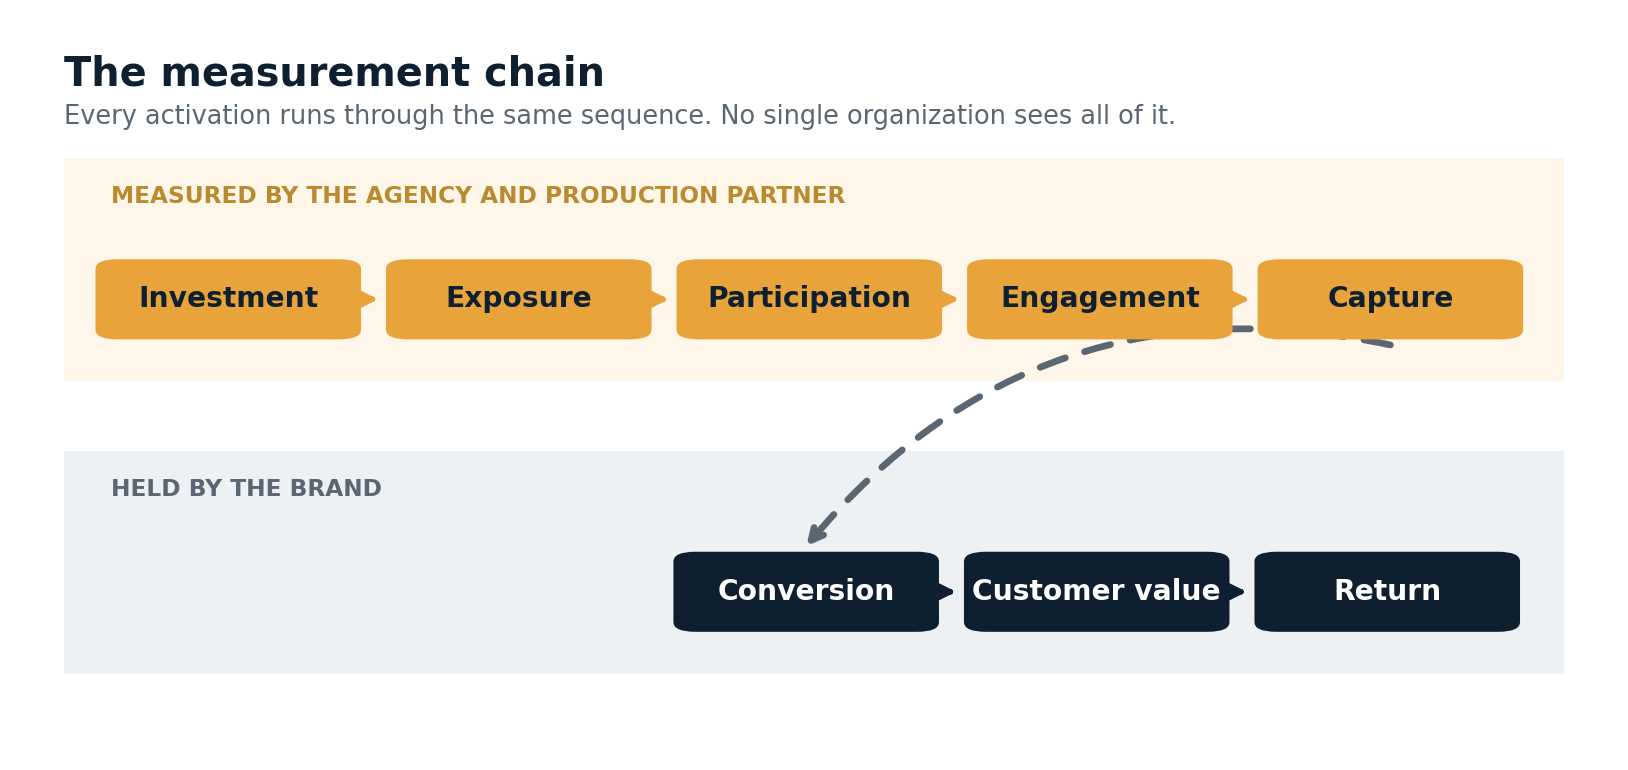
Sections 06 to 12 follow that chain in order, establishing at each stage what is known, what can be calculated, and what would be required to close the remaining distance.
| Section | The question it addresses | Where it sits on the chain |
|---|---|---|
| 06. How events are measured | What is measured in practice, and why is measurement distributed as it is? | The whole chain |
| 07. The mechanism | Why does a shorter, better experience outperform a longer or larger one? | Engagement |
| 08. Reach and earned value | What does an activation deliver, and what does a brand no longer have to buy because of it? | Exposure and reach |
| 09. Cost, attendance and breakeven | What can be calculated from cost and attendance, and how should the rest be framed? | Investment through conversion |
| 10. Depth against throughput | How do reach and engagement quality trade against each other? | Participation and engagement |
| 11. Categories and customer value | What must a customer be worth for the economics to work? | Customer value and return |
| 12. How measurement could work | What methods exist, what do they cost, and what is being left uncollected? | The whole chain |
Part three: The calculation
Section 13 sets out how a brand can calculate the return on investment for an activation. The same event produces six revenue streams, each with a market price and each measurable from data an activation already generates. Assembled, they show what the measurement chain described in part two is worth when it is connected end to end, and in what order the inputs have to be established.
Reading the figures
Numbered references appear in square brackets throughout, corresponding to the list at the end of the appendix. Each section closes with a note listing every source it draws on.
Scope and limitations
Three limitations shape what this report can and cannot establish, and each is worth stating clearly so that the findings are read against the right expectations.
Confidentiality limits figures
Client confidentiality is the single most significant constraint on this research. The constraint reflects how the industry operates rather than any reluctance among participants. Almost every interviewee works under confidentiality obligations to the brands they serve, and several raised this before being interviewed.
Those obligations are entirely reasonable. An agency that discloses a client's activation budget, conversion rate or customer economics has disclosed that client's competitive position. Participants were generous with method, judgment and observation, and were consistently candid about what they had seen work and not work. What they could not do, in most cases, was attach specific commercial figures to specific clients.
This has two consequences for the report. Cost and budget figures are estimated under the labeling convention described above, so that the figures can be used in a broad sense without any specific examples being shared. The downstream commercial data, conversion rates and customer values, was largely unavailable, because it sits with the brand rather than with the parties interviewed and is commercially sensitive in both places.
Rather than treat that as a gap to be filled with assumptions, the report reframes the calculation so that the unavailable quantity becomes something a brand can test against its own figures. Section 09 sets out that approach, and Section 12 examines what it would take to close the gap directly. The constraint shaped the method, and in the view of this research it produced a more useful output than a modeled figure would have.
The interview base is weighted
The interview base is weighted toward consumer, sports and live experiential work in North America. Retail and healthcare deployments are not represented, and international markets outside North America appear only through published data. Findings should be read as applying to the segments represented, and the report indicates where a finding is segment-specific.
Ten interviews is a substantial qualitative base for a study of this kind, and it is not a statistically representative sample. Where a finding rests on a single account it is identified as such. Where several participants in different positions arrived at the same observation independently, that convergence is noted, and it is the strongest form of evidence this method produces.
This is an exploratory study
This is an exploratory piece of research into a question that the industry has not settled. It maps the terrain, establishes what can be calculated from available evidence, identifies where the remaining uncertainty sits, and proposes a practical approach for brands weighing an investment decision.
Several findings would benefit from further work, and the report says so where that applies. Dwell time and engagement depth are measurable, and were unknown to participants at the time of the interviews. Conversion from attendance to purchase is measurable and sits with brands rather than with their agencies. Both are addressable, and Section 12 sets out how. The intention is that this report is a useful starting point for that work rather than the last word on it.
01 Market Size and Growth
Published forecasts, practitioner accounts, and the difference between them.
A market in sustained expansion
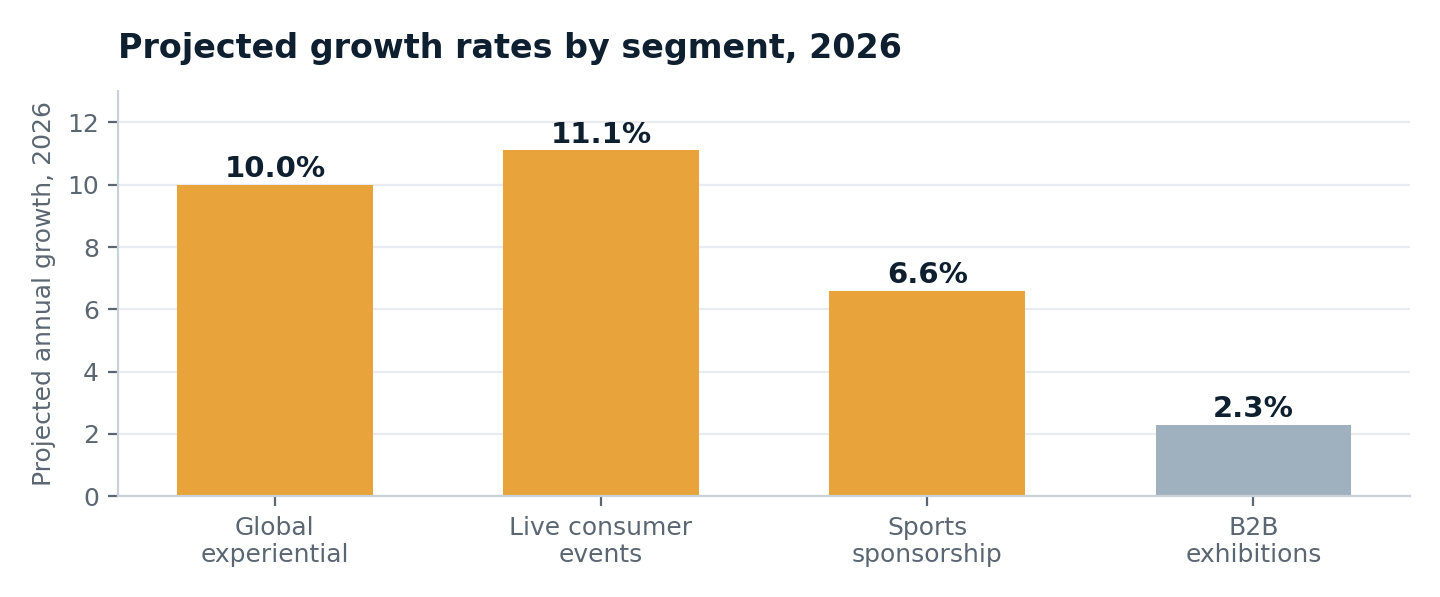
Published forecasts describe a market in sustained expansion. Global experiential marketing was valued at $139 billion in 2025, eight percent above the prior year, with ten percent growth projected for 2026 [ 43 ]. The Winter Olympics, the FIFA World Cup and an election cycle underpin that projection.
Live consumer events grew fastest within that total, at 11.1 percent. Event sponsorship accounted for $23.92 billion of the United States business-to-consumer segment, and sports was the largest of six categories at $16.98 billion [ 43 ].
The sports sponsorship market is forecast separately. It reaches $74.59 billion in 2026, up from $70.2 billion in 2025, with projections of $96.45 billion by 2030 at a compound annual growth rate of 6.6 percent [ 44 ].
Budgets tightening rather than expanding
Interview accounts do not straightforwardly match these figures from the industry side, as most interviewees described budgets tightening rather than expanding. An agency interviewee working with financial services clients described sponsors reducing spend on large-scale sports properties and redirecting it toward community-level programs. The same interviewee noted a visible reduction in exhibitor investment at a major annual technology show compared with previous years.
A production agency leader described fewer events taking place and a decline in their elaborateness, while noting that spending on events continues. A business development interviewee described prospective clients arriving with budgets substantially below the cost of the work they were requesting, with the result that opportunities did not proceed.
One account ran the other way. An agency interviewee working across collegiate championship events described investment as having expanded significantly in recent years, with budgets rising year over year both for her own client and among neighboring brands at the same events.
The investment in it has been huge. It's blown up over the past few years, and brands are realizing it's a place where they need to spend more money.
Segments moving in opposite directions
Disaggregating by segment reconciles most of the difference between accounts. Consumer and fan-facing experiential activity is expanding. Business-to-business exhibitions are not.
Exhibition growth is estimated at 2.5 percent in 2025 and 2.3 percent in 2026, and the sector is not forecast to return to 2019 levels within 2026 or 2027 [ 45 ]. Third-quarter 2025 index data places exhibitor numbers approximately five percent below the 2019 benchmark, net exhibit space 8.3 percent below, and attendance 12.3 percent below [ 46 ].
Planner expectations point the same way. Twenty-three percent expect to produce more meetings in 2026 than in 2025, the lowest proportion recorded in at least three years, and 40 percent expect attendance to decline by ten percent or more [ 50 ].
The one direct client interviewed for this report, a national membership organization running an annual conference, reported a 35 percent reduction in attendance between 2025 and 2026 [ 85 ]. She attributed it to corporate members withdrawing participation for reasons related to economic caution among smaller member businesses.
| Measure | Consumer and sports experiential | Business-to-business exhibitions |
|---|---|---|
| Projected growth, 2026 | 10.0 to 11.1 percent | 2.3 percent |
| Position against 2019 | Exceeded | Attendance 12.3 percent below |
| Recovery forecast | Not applicable | Not before 2028 |
| Practitioner accounts | Budgets rising year over year | Attendance and participation declining |
| Planner expectations | Not applicable | 40 percent expect attendance to fall 10 percent or more |
Volume is not the only measure available for this segment. Independent research among exhibitors finds 64 percent scaling back their overall presence at events, which accounts mechanically for part of the decline in exhibitor counts and floor space [ 52 ]. Over the same period, 75 percent rate the overall value of their event programs as excellent or good, a figure that rose eight points in a single year [ 52 ]. This points to fewer appearances, chosen more selectively, with satisfaction rising rather than falling.
The split runs along segment lines, with interviewees reporting expansion working predominantly in consumer sports and entertainment and those reporting contraction working predominantly in corporate, association and trade show contexts.
The picture is geographically specific as well. A global survey of 466 exhibition organizers across 59 countries, concluded in June 2026, records 27 percent expecting annual revenue growth above five percent and 38 percent expecting stable revenues, a more stable position than the United States index data alone would suggest [ 47 , 48 ]. Economic impact analysis of the sector is published separately and covers a wider definition of exhibition activity than the index data [ 49 ].
Expenditure growth indicates that budgets are being allocated. Whether that allocation reflects performance is a separate question, and Sections 04 and 05 examine two mechanisms that raise spend without any assessment of return taking place.
References for this section: 43 , 44 , 45 , 46 , 47 , 48 , 49 , 50 , 52 , 83 , 85 .
02 Consumer Demand for Live Experience
Where discretionary spending is moving, what attendees report wanting, and how demand differs between consumer and business events.
Spending is shifting to experiences
The evidence for consumer appetite comes principally from outside the events industry: spending analysis, card transaction data, public company reporting and commercial property markets.
Growth in spending on nonessential goods slowed to 0.8 percent across the 2023 to 2025 period, against 2.3 percent in the equivalent period before the pandemic. Over the same window, spending on travel experiences grew at 4.4 percent, close to its pre-pandemic rate [ 59 ]. The divergence is not that experience spending accelerated. Goods spending stalled while experience spending held.

In 2025, United States landlords leased more commercial space to service-oriented tenants than to traditional retailers, with wellness, fitness and experiential concepts among the fastest-growing categories [ 59 ]. People are spending their money on doing things rather than buying things, and the property market is changing shape around it.
Prices and attendance rising together
Transaction data provides a firmer basis than survey responses, and the available figures are consistent.
Live Nation Entertainment, the largest operator in live entertainment, reported record event-related deferred revenue of $6.4 billion in its second-quarter 2026 results, an increase of 25 percent [ 60 ]. Deferred revenue here represents money consumers have already committed for events that have not yet taken place, which makes it a forward indicator rather than a retrospective one.
The company projected full-year fan attendance growth of 10 percent, with attendance at operated venues rising by double digits, and reported onsite food and beverage spending up by high single digits year to date.
Consumer spending on live sports sits 25 percent above pre-pandemic levels, outpacing growth in live music spending, according to Bank of America Institute analysis of credit and debit card transaction data [ 61 ]. Over the same period the average United States concert ticket price reached $144, approximately 45 percent higher than in 2019 [ 61 ].
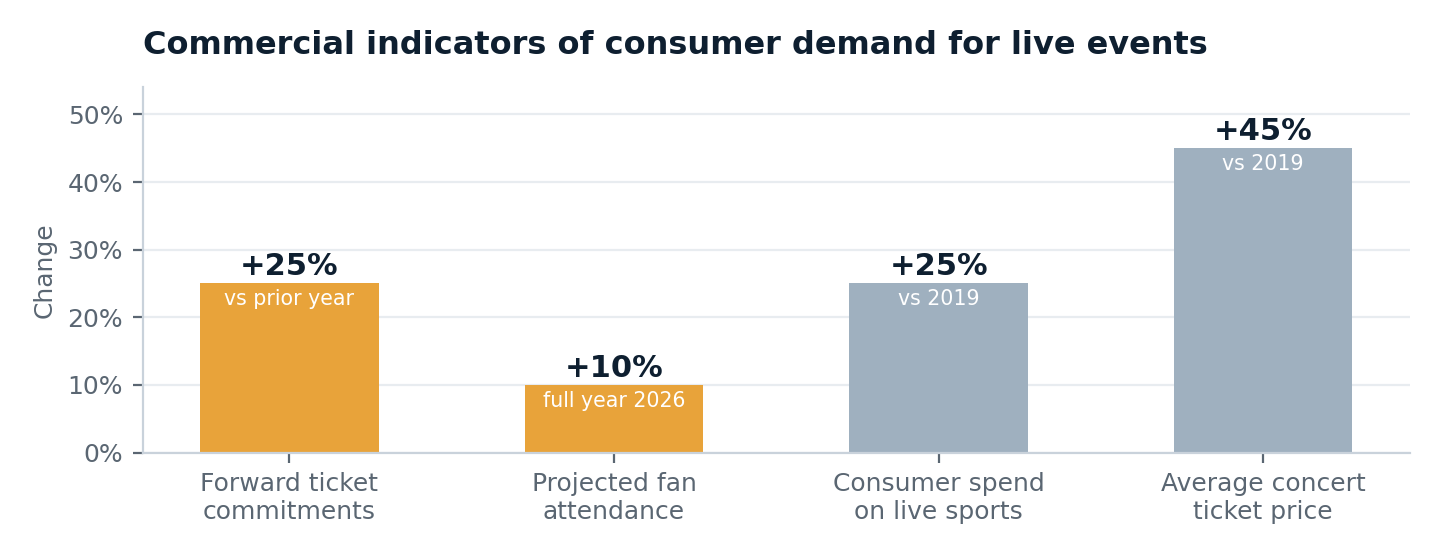
Prices have risen sharply, attendance has risen alongside them, and forward commitments have risen faster than either. Demand of that character, holding through a significant price increase, is unusual in a discretionary category.
Spending reallocated, not withdrawn
Consumer research draws a direct line between the shift toward experience and periods of economic constraint. It identifies a comparable pattern following the Great Recession, when consumers moved away from goods and toward experiences as a means of finding meaning and connection while money was tight [ 62 ].
Recent holiday spending data illustrates the effect within a single period. The proportion of Americans planning to shop over a holiday weekend rose from 36 to 54 percent, while the average amount they planned to spend fell from $289 to $86, a decline of 70 percent [ 63 ]. Over the same weekend a record 45 million Americans traveled at least fifty miles from home, with average trip spending near $900 [ 64 ].

More people shopping, spending considerably less, while traveling in record numbers and spending substantially on doing so. On this evidence discretionary spending is being reallocated rather than withdrawn, and the reallocation favors experience.
Employers constrain business events
Demand for business events requires separate treatment, because the person who wants to attend and the person who authorizes the cost are frequently not the same.
Attendee-side survey evidence is consistently positive. Research by Freeman places attendee preference for in-person formats above 80 percent [ 65 ]. A 2026 event marketing benchmark survey found 54 percent of attendees intending to attend more in-person events than in the previous year, and 71 percent identifying in-person conferences as the most effective format for learning about new products or services. In the same survey, 78 percent of organizers described in-person conferences and conventions as their most impactful marketing channel [ 66 ].
Employer-side indicators move in the opposite direction. The average business trip cost $1,128 in 2025, against $834 in 2024 [ 69 ]. Twenty-nine percent of corporate travel buyers anticipated volume declines of around 21 to 22 percent [ 69 ], and 40 percent of meeting planners expected attendance to fall by ten percent or more [ 50 ].
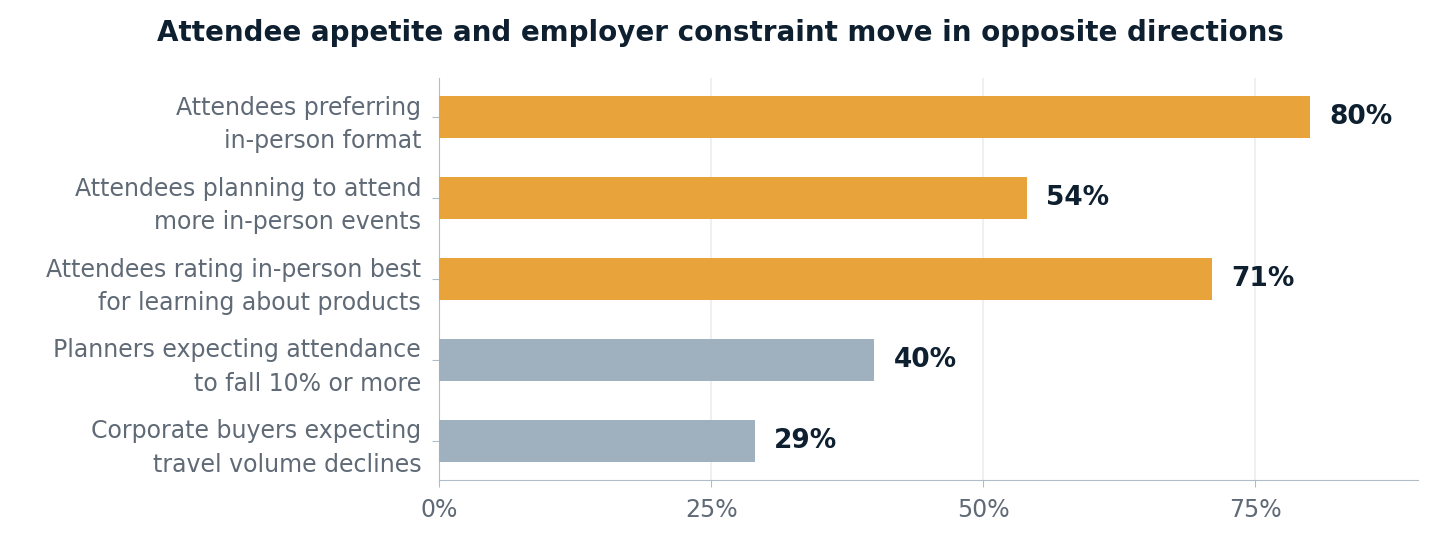
This distinction is material for interpreting the attendance declines described in Section 01. The direct client interviewed for this research attributed her organization's 35 percent reduction in attendance to corporate members withdrawing participation, rather than to individual members losing interest.
Her account is one organization's experience, and it is consistent with the pattern the survey data describes. However, demand among attendees is not the binding constraint; travel cost and employer authorization are.
Willingness to pay beats stated intent
Published benchmarks place no-show rates at free events between 40 and 60 percent against attendance rates of 90 to 97 percent at paid events, while platform data measuring registration check-in finds a narrower gap, with no-show rates at roughly 28 percent for free events against 17 percent for paid [ 70 , 70b ]. Either way, there is a significant difference, which is unlikely to be explained by content quality alone.
Payment functions as a filter, selecting for attendees with sufficient intent to commit money in advance. The same variable appears in Section 11, where research on customers acquired through free trials found substantially lower subsequent value [ 33 ]. It appears again in the permanent installation examined in this report, which operated free of charge and recorded a repeat visitation rate of 2.2 percent [ 84 ].
Paid attendance is the norm in the association and trade show sector, where attendance has always funded some or all of the event. The direct client interviewed for this research runs an annual membership conference on that basis, with revenue from sponsorship packages, exhibitor space and individual passes.
It is not the norm in brand activation, where free entry is the convention. A production agency leader reported encountering a growing number of clients running branded event series that participants pay to attend, naming operators across professional services, fitness and business education, and characterized this as events moving from a cost center to a revenue line. That is his account of what he has observed rather than a measured market trend. If it holds, it describes brands discovering that people will pay for an experience that has always been free.
In-person contact is valued for trust
A separate line of evidence concerns why consumers value in-person contact. Research conducted by The Harris Poll on behalf of Freeman, published in March 2025, found that 71 percent of brands recorded a decline in corporate reputation through other channels during 2024, while 95 percent of attendees reported trusting a brand more after taking part in an in-person event. Among event decision makers surveyed in the same study, 93 percent reported a positive effect on brand trust and 92 percent on brand recognition and on the number of new clients [ 86 ]. A companion study in the same series reported that 82 percent considered in-person settings the best environment for building working relationships [ 87 ].
These figures should be read with their provenance in mind. Freeman is one of the largest operators in the events industry, and the research is industry-sponsored. The direction of the finding is nonetheless consistent with independent data on declining trust in media and advertising, and the sample and method are disclosed, which is not true of much of the material circulating in this category.
A second, larger study points in a related direction. VML's Future 100 for 2026 collected responses from approximately 15,600 people across 16 markets between September and November 2025. It reports 87 percent of consumers globally agreeing that the best brand experiences leave them feeling changed rather than merely entertained, and 86 percent drawn to encounters that inspire a sense of awe or a renewed perspective [ 88 ]. The report characterizes this as an evolution from an experience economy described by Pine and Gilmore toward what it terms a transformation economy [ 88 , 106 ].
The same study records 73 percent of respondents wanting brands to be more entertaining, a lower bar and a different measure. Read together, the two figures suggest an audience receptive to brand-run experience but discriminating about what it accepts, which is consistent with the depth findings examined in Section 10.
Research published by The Harris Poll with Quad in February 2026 found 76 percent of Americans reporting that they connect more deeply with brands through in-person retail experiences, and framed physical brand spaces as destinations in their own right [ 89 ].
Motives are social, not informational
Survey evidence on attendee motivation is consistent in direction, though it should be read as reported preference rather than observed behavior. Research published by Hilton for 2026 found 49 percent of attendees identifying meeting new people and bonding with colleagues as their principal reason for attending work events, and 84 percent describing exposure to local culture as a significant benefit [ 68 ].
Interviewees described comparable expectations, and their accounts are individual perspectives rather than measured findings. A business development interviewee characterized the shift in terms of participation.
From a spectator perspective, people are looking for experiences, different value exchanges, the use of technology where it provides something to do, where they could take away something, experience something and not just be talked to.
He connected this to a broader observation about attention, suggesting that the move to remote and hybrid working has shortened tolerance for passive formats. An agency interviewee working across collegiate championship events reported that her clients are seeking in-person physical experiences in preference to digital alternatives, on the basis that the in-person version is more impactful.
Both accounts describe what these practitioners observe among their own clients, and neither is presented here as an industry-wide finding.
References for this section: 33 , 50 , 59 , 60 , 61 , 62 , 63 , 64 , 65 , 66 , 68 , 69 , 70 , 70b , 83 , 84 , 85 , 86 , 87 , 88 , 89 , 106 .
03 What Live Experience Produces
Published research on the effects of live experience, and the distinction between intention and transaction.
Four ways of producing evidence
Claims about what live experience produces rest on four different methods, each answering a different question. This section works through all four, in the order below.
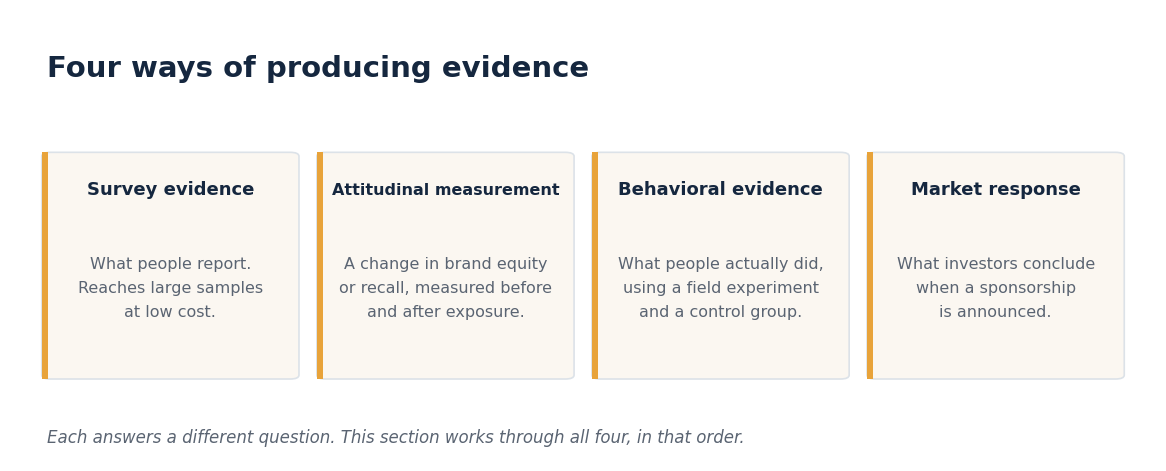
Survey evidence records what people report. It reaches large samples at low cost and captures disposition, which is what most published research in this category measures.
Attitudinal measurement records a change in something observable, typically brand equity or recall, taken before and after exposure. Brand equity in this sense is the differential effect of brand knowledge on how a consumer responds to marketing, which is the construct the studies in this section measure [ 96 ].
Behavioral evidence records what people actually did, using a field experiment and a control group. It establishes cause directly.
Market response records what investors conclude when a sponsorship is announced. It comes from outside the events industry entirely.
Six in ten report more purchase intent
The principal annual benchmark study of event marketing, surveying more than a thousand marketers and event attendees, finds that 61 percent of consumers are more inclined to purchase a product or service after taking part in an event or experience [ 66 ]. The study has been conducted annually for more than a decade, so the figure comes from an established series rather than a one-off reading [ 67 ].
Six in ten is a substantial result, and it is consistent in direction with everything else in this section. Respondents are reporting a shift in disposition following an experience, which is a real and relevant outcome, and it is the outcome most directly connected to the objectives practitioners described.
The same study also records what draws people to engage in the first place. Free samples are the leading reason at 60 percent, ahead of branded merchandise at 57 percent and discounts or offers at 52 percent [ 66 ]. Trial is the most effective engagement mechanism available, which is notable because trial is also where the strongest behavioral evidence in this section sits.
Brand equity rose in all four formats
One study addresses the question in this report more directly than any other. Zarantonello and Schmitt measured brand equity among consumers before and after they attended an event, across four distinct formats: trade shows, street events, pop-up shops and sponsored events. Attendance had a positive effect on brand equity in every format tested [ 90 ].
The size of that effect differed considerably by format. Overall brand equity rose from 4.00 to 4.31 at sponsored events, from 4.58 to 4.77 at trade shows and from 4.31 to 4.55 at street events. At pop-up shops it rose from 3.59 to 4.39, a gain three to four times larger than any of the others. Standard deviations across these measures run between 1.5 and 1.8, so the first three changes represent a small fraction of the variation within each group. Pop-up shops also began from the lowest pre-event position of the four formats, and some part of the difference is likely to reflect the distance available rather than the format alone [ 90 ].
The more useful finding is the mechanism. The effect ran through brand experience, meaning the sensory, emotional and behavioral response the event produced, in all four formats. Brand attitude, a more considered evaluation, mediated the relationship only at trade shows and street events. In other words, what the attendee felt and did carried the effect more reliably than what they concluded.
That has a practical implication which the rest of this report follows. If the effect operates through experience rather than through evaluation, then design choices about depth, participation and sensory quality are the mechanism by which the investment works, and Sections 07 and 10 examine them on that basis.
Academic work rarely measures behavior
Academic research is narrower in scope and more careful in its claims. A 2025 study surveyed 1,009 spectators at sports events to examine how brand experience influences loyalty, finding that the relationship is mediated by attitude and subjective norms rather than operating directly [ 16 ]. An earlier study surveyed 238 runners immediately following a road race and found that experiential activation significantly influenced the sponsor's brand equity, with brand equity in turn mediating the path to purchase intention [ 17 ].
Notably, satisfaction with the sponsorship itself showed no significant effect on purchase intention, while brand equity did. Enjoying an activation and being moved to buy are not the same response, and the study suggests that only the second travels. Both studies are sport-specific, which is relevant given the composition of this research, and both measure intention rather than completed purchase.
These findings sit within a wider literature. Two meta-analyses of sponsorship effectiveness, published in 2015 and 2025, establish that sponsorship reliably produces cognitive and affective effects, while noting that behavioral outcomes are measured far less often and that effect sizes vary considerably with sponsor familiarity and content type [ 14 , 15 ].
The wider effectiveness literature is relevant here too. Analysis of the IPA Databank found that emotionally driven campaigns produced very large profit gains in 31 percent of cases against 16 percent for rational ones, outperformed rational campaigns on every business metric measured, and built more strongly over time [ 18 , 95 ]. Live experience is emotional and participatory by construction, which places it on the side of that divide associated with slower and more durable effects, and correspondingly with the measurement difficulties Section 06 describes.
The conceptual foundation for treating experience as a distinct marketing object was set out by Pine and Gilmore and by Schmitt in the late 1990s [ 1 , 2 , 3 ], building on earlier work establishing the experiential dimension of consumption [ 4 ], and was given a validated measurement instrument by Brakus and colleagues, whose brand experience scale distinguishes sensory, affective, intellectual and behavioral dimensions and links them to satisfaction and loyalty [ 5 ].
Industry-sponsored research reaches consistent conclusions on the attitudinal measures. The 2025 Freeman study reports that 92 percent of working professionals said live events positively influenced how they thought about a brand, that 89 percent felt closer to the brand afterwards, and that 47 percent said the resulting positive perception lasted a few months or longer, with 18 percent reporting six months or more [ 86 ].
The duration finding is the more useful of these. Persistence over months is the property that distinguishes brand-building activity from short-term response, and it is measured far less often than immediate reaction.
The most substantial evidence of behavioral effect comes from field-experimental work on product sampling published in Marketing Science. Based on two field experiments, that study found free samples producing measurable effects on sales observable as much as twelve months afterward, in contrast to price promotions whose effects decay within weeks [ 13 ]. It also found effectiveness varying widely between brands within the same product category, which indicates that no single conversion benchmark is likely to transfer between contexts [ 13 ].
The same work decomposed the apparent effect into three components: acceleration, expansion, and cannibalization. Acceleration describes existing customers purchasing earlier than they otherwise would. Expansion describes purchasing by people who would not have considered the brand. Cannibalization describes purchases that replace ones that would have occurred anyway. Only expansion represents genuinely incremental gain. Separating the three requires a comparison group who did not attend, which no activation described in this research had, so any conversion figure observed after an event contains all three and overstates incremental gain by an unknown margin. Section 13 sets out what establishing that comparison group would involve.
Physical presence changes the response
A separate body of experimental work helps explain why an in-person encounter differs from a mediated one, and it does so through controlled tests rather than survey response.
The first concerns touch. Merely handling an object has been shown to increase a person's sense of ownership of it, and that perceived ownership in turn raises what they are willing to pay, even where no legal ownership exists and where the object carries no useful tactile information [ 92 ]. Subsequent work found that the longer the physical contact, the larger the increase in valuation [ 97 , 98 ].
This is directly relevant to activations built around product handling. It is the clearest experimental support available for the proposition that time spent matters, a variable Section 10 returns to and which no participant in this research measured.
The second concerns direct contact. In a controlled study, 45 participants made an identical request to 450 strangers, half in person and half by email. The in-person requests were 34 times more likely to succeed [ 93 ].
The researchers' explanation is instructive. The people sending emails were confident their requests would be persuasive, because they judged them against their own knowledge of their good intentions. What they could not see was how the same message appeared to a stranger. Follow-up work found the same pattern holds across video and telephone channels, with in-person remaining the most effective and requesters consistently underestimating the difference [ 94 ].
Neither study concerns brand activation. Both describe the underlying asymmetry an activation exploits: physical presence carries information, credibility and a claim on attention that a message delivered at a distance does not, and the parties choosing between the two routinely underestimate the gap.
Independent market evidence is mixed
Not every line of research points the same way, and the strongest test comes from outside the industry entirely. A meta-analysis covering 3,192 sponsorship announcements across 36 studies found a positive average market reaction overall, concentrated in the 1990s and turning negative during the 2000s [ 91 ].
A sponsorship announcement is the front end of a live experiential commitment, since the rights fee is followed by activation spend that industry estimates place at roughly three times its value, as Section 04 sets out. When the market stopped rewarding those announcements, it was discounting the expected commercial return on the physical programs that follow them.
The useful part is the timing. Nothing in the evidence on how people respond inside a physical space deteriorated after 2000, and the strongest findings in this section are recent. What changed is that every competing channel became attributable, and sponsorship did not. On that reading the negative market reaction is a verdict on the measurement chain rather than on the experience, and it is the same verdict Section 06 arrives at from the opposite direction, through practitioners who cannot see past the boundary of their own organization. Investors priced the gap two decades before the industry named it.
Objectives form a progression
When asked what brands are seeking from an activation, a sponsorship consultant with a decade of prior experience at a league office described a progression rather than a single objective: brand awareness first, then meaningful engagement and storytelling, then reach and impressions, and finally conversion.
Are fans, as a result of these partnerships, converting and becoming customers of our brand? I think that's the biggest thing for a lot of brands.
That progression contains two distinct kinds of measure. Awareness, engagement and reach are objectives an activation can achieve on its own terms, and are properly understood as return on objective. Conversion and the revenue that follows are return on investment in the sense a finance function would recognize.
The two are frequently reported together and evaluated as though they were the same thing, which is a principal source of confusion in this category and a reason no single return figure has ever been satisfactory. The same distinction has been reached independently within the industry: the 2025 Freeman research recommends that brands go beyond return on investment to include return on investment objective, capturing brand awareness, customer satisfaction and retention, market expansion and product development success [ 86 ].
What is established, then, is that live experience produces effects on memory, disposition and in some contexts on purchasing over an extended period. What is not established by any of this research is the rate at which those effects convert into transactions. Section 06 examines how the industry currently measures events, and where that measurement stops.
References for this section: 1 , 2 , 3 , 4 , 5 , 13 , 14 , 15 , 16 , 17 , 18 , 66 , 67 , 83 , 86 , 90 , 91 , 92 , 93 , 94 , 95 , 96 , 97 , 98 .
04 Activity Outside the Official Footprint
Rising costs at contracted venues, the response by exhibitors and brands, and what it means for how the market is measured.
Most spend never reaches the experience
Material handling, labor, electrical provision, rigging, flooring and internet access are contracted through the venue's designated services provider rather than purchased in an open market, and the rates are set accordingly.
A widely used industry framework holds that total trade show costs run at approximately three times the cost of the exhibit space itself, so a $20,000 space implies something closer to $60,000 in total commitment. The same source finds that most exhibitors underestimate their total costs by twenty percent or more [ 53 ].
Sponsorship follows a comparable pattern, with long-standing industry estimates placing activation spend at roughly three times the rights fee [ 54 ].

Show service rates outpace inflation
The Exhibitor Advocate, a nonprofit association dedicated to exhibitor interests, publishes an annual survey of exhibition rates produced with Tradeshow Logic and independently audited by EVOLIO Marketing. The 2025 edition analyzed 224 publicly available exhibitor manuals and rate forms across 23 major United States cities, and for the first time traced how rates have moved across four years [ 51 ].
Material handling base rates rose 9.5 percent in 2025 to a national average of $2.28 per pound, and have risen 21.3 percent since 2022. Electrical outlet rates rose 18.4 percent in a single year to a national average of $204.91 for a basic 120 volt, 5 amp drop, against United States inflation of 2.7 percent over the same period [ 51 , 55 ]. Electrical overtime labor has risen 41.2 percent since 2022. Display labor straight time rose 6.4 percent to a national average of $157.48 per hour. Flooring components rose sharply, with carpet up 12.7 percent, padding up 21 percent and vacuuming up 30 percent.

The survey also records declines. Hanging sign and lift rates fell an average of 15.3 percent, the largest single-category decline in the survey's history, and secondary material handling rates fell 15.4 percent.
Geography matters as much as category. A standardized basket of fourteen common exhibition services costs over 75 percent more in New York than in Atlanta.
Practitioners report steeper rises in costs
A production agency interviewee described these costs from the practitioner side, characterizing material handling as having approximately doubled and labor rates as having risen from $185 to $220 per hour. He identified them as among the largest cost drivers in an activation and as invisible to the client as a component of the experience being purchased.
Customers don't see that as an experience or part of their booth, but it's one of the biggest cost drivers in the entire thing.
Set against the audited survey, his account is directionally consistent and higher in magnitude. The survey records material handling up 21.3 percent over four years rather than doubling, and a national average display labor rate of $157.48.
The point on which the practitioner account and the audited data agree is the one that matters: a substantial and growing share of activation cost is consumed by services the audience never perceives.
Fewer events, rated more highly
Companion research published alongside the rate survey provides the clearest available picture of what exhibitors are doing in response. Eighty percent cite cost management as their principal challenge. Fifty-five percent report that increased costs outweigh the value of the investment at some events. Sixty-four percent are scaling back their overall presence [ 52 ].

The fourth figure in that set complicates the first three. Seventy-five percent of exhibitors rate the overall value of their event programs as excellent or good, and that figure rose eight points in a single year.
Read together, these findings describe selectivity rather than retreat. Exhibitors are appearing at fewer events, spending more carefully at the ones they choose, and reporting better outcomes as a result. This is consistent with the segment data in Section 01, where exhibition metrics remain below their 2019 position while practitioners describe brands continuing to invest.
Brands are moving outside the event footprint
Three interviewees, working in different segments and with no connection to one another, independently described the same response: activations located in space near an event rather than inside it.
A production agency leader described clients taking over nearby premises, a coffee shop or a retail unit, in order to control the environment without operating under venue service contracts. A second interviewee at the same organization described comparable arrangements in public space, alongside a growing preference for mobile formats on the grounds that a touring asset can be used across multiple markets rather than built and struck for a single occasion.
A third, describing a recent college football championship final, said the volume of experiential activity taking place away from the official site had been the most striking feature of the event.
These are three practitioners' observations rather than a measured trend. What makes them worth recording is their independence: three people in different roles, describing different events, arriving at the same observation without prompting.
The most developed example of the pattern is South by Southwest in Austin, which draws approximately 300,000 attendees and where the practice is now the dominant format.Trade coverage describes brands taking over parking lots, music venues, restaurants and bars across the city, with some participating as official sponsors and others operating independently [ 57 ].
Documented examples include a streaming service converting a downtown bar into a themed environment that drew more than 5,000 guests across three days, a media brand occupying the same downtown bar for four consecutive years, and an audiobook service converting a parking lot into a temporary carnival. In 2026, one media brand wrapped a 39,000-square-foot hotel facade with nightly projection mapping, delivered from brief to launch in four weeks, alongside seven further installations across the downtown area.
The scale of temporary space use more broadly is substantial. United States temporary retail and pop-up revenue reached $15.6 billion in 2025, with approximately 42,500 businesses operating a temporary retail space during the year [ 56 ]. Average retail rent runs about $25.93 per square foot per month [ 56 ], which for a footprint equivalent to a large exhibit stand represents a materially different cost structure from a contracted venue.
Moving out cuts cost and certainty
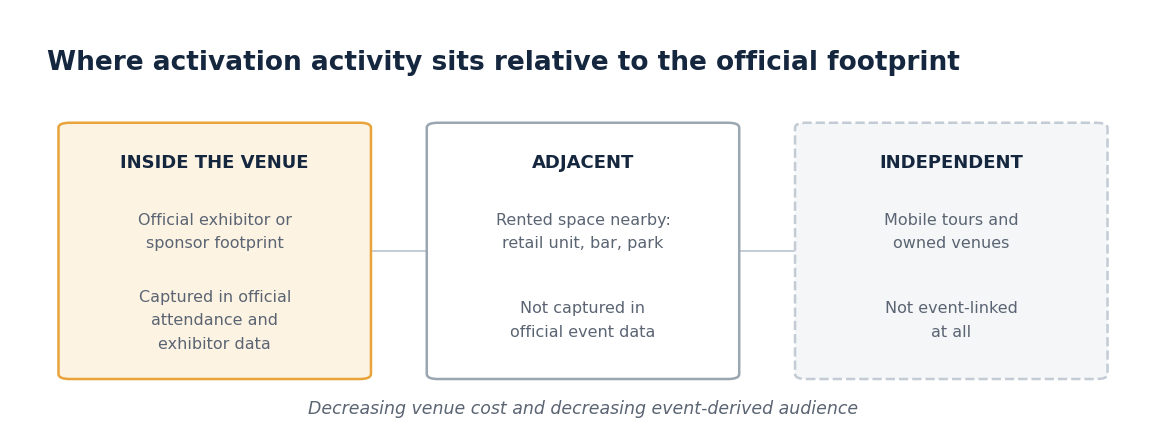
The accounts collected in this research describe three distinct positions, each carrying a different cost structure and a different relationship to the event audience.
| Position | Cost characteristics | Audience | Data visibility |
|---|---|---|---|
| Inside the venue | Space fee plus contracted services at roughly three times the headline figure | Delivered by the event | Recorded in official attendance and exhibitor data |
| Adjacent | Commercial rent plus production, without contracted service requirements | Present, but must choose to travel | Not recorded in official event data |
| Independent | Fabrication amortized across multiple stops | Built rather than inherited | Not event-linked |
The trade is straightforward. Moving outward reduces the cost of access and reduces the certainty of the audience. Inside the venue the audience is delivered. Adjacent, the audience exists but must choose to travel to the location. Independent of the event, the audience must be built, which is why interviewees described mobile formats in terms of repeated use across markets rather than as a substitute for event presence.
Moving outside a venue also transfers cost rather than removing it. Practitioner guidance on offsite formats identifies venue rental, catering and production as costs that persist, alongside two operational constraints: capacity is typically lower than an on-site footprint, and the activation competes with the official program for attendee time [ 58 ].
Published figures miss outside activity
The most significant implication of this shift is not tactical, it concerns how reliably the market can be measured.
Official exhibition and attendance figures record activity that takes place within contracted venues. Exhibitor counts, net square footage and attendance are all measured inside the perimeter. Where a brand rents adjacent space, operates a mobile format or activates in a nearby public space, that activity falls outside the boundary at which industry data is collected. Research on temporary retail makes the same point about its own category, noting that no centralized database exists and that total activity is therefore difficult to estimate [ 56 ].
This offers a partial explanation for the discrepancy identified in Section 01. Published exhibition data shows a sector below its 2019 position and growing slowly, while several interviewees described brands continuing to invest and, in some segments, increasing investment.
If a growing share of activity has moved outside the measurement boundary, both accounts can be accurate at once. Activity inside contracted venues may genuinely be flat while total experiential activity grows.
The extent of this cannot be established from the available evidence. No published source tracks activation activity outside official footprints. What can be stated is that a measurement boundary exists, that exhibitors report scaling back presence while rating value more highly, that practitioners describe activity moving across that boundary, and that published exhibition figures should be read as a measure of activity within contracted venues rather than as a measure of experiential activity overall.
Cost is one force acting on where and how brands appear. Section 05 examines a second, which operates independently of any assessment of return.
References for this section: 51 , 52 , 53 , 54 , 55 , 56 , 57 , 58 , 83 .
05 Competition and Choice
How brands choose where to appear, how audiences choose what to attend, and what competition does to expenditure.
Two sets of choices
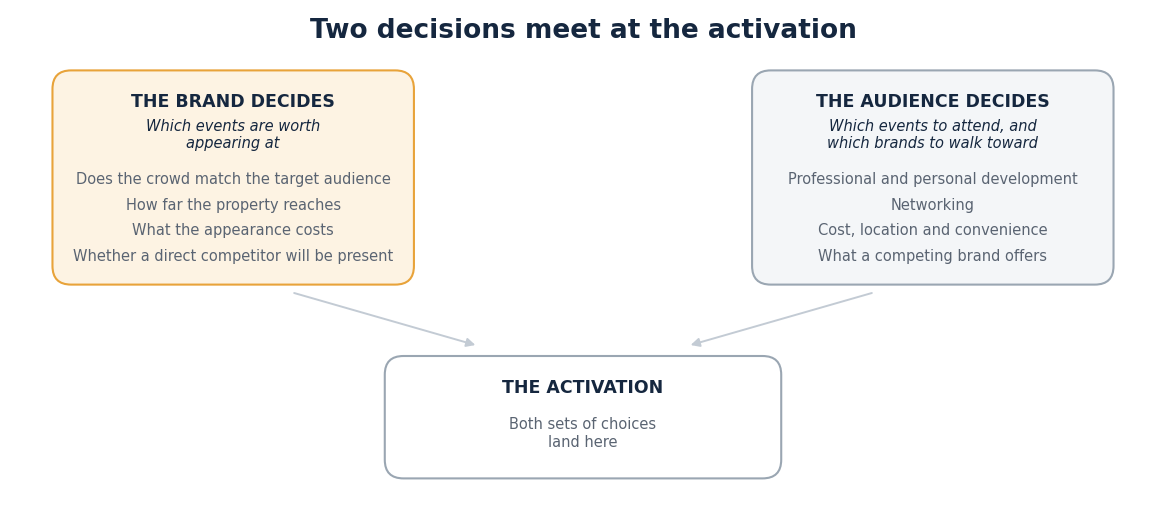
There are two sets of choices before every activation, those made by the brand and those made by the audience. Every event a brand appears at was chosen by that brand over other events, and almost every person standing in front of the build chose to be there over other events. These choices create competitive pressure because brands have to make the correct decisions as to which events to attend while anticipating that customers will be there.
The first set of decisions belongs to the brand. More properties are available in a season than any brand can afford to appear at, so somebody decides which ones are worth the money, before any design brief is written. That decision rests on what the brand knows about the event, who turns up to it, what an appearance will cost once contracted services are included, and in some cases whether a direct competitor will be standing nearby.
The second set of decisions belongs to the audience, and it comes in two forms. At a conference, a trade show or a dealer incentive trip, attendance is voluntary in the first place, so a person weighs one event against competing events and against staying at work. Once at the event such as a championship game or a music festival, the choice that remains is what to do with the hours inside. An activation there competes for time against every other activation on the site, and against the event itself.
Properties compete to be chosen, because a brand can decline any of them and appear somewhere else instead. Brands at the same event compete to be walked toward, because an audience can spend its hours on the build next door. A brand that loses the second of those contests has paid for a footprint people passed by, and it has no measure of that beyond what its staff saw on the floor.
Section 04 sets out cost pressure as one force acting on where and how brands appear. This section sets out a second. What the two have in common is that neither involves an assessment of what an activation returns financially. A brand can raise its spending because a venue raised its rates, and it can raise its spending because a competitor built something larger last year, and in both cases the increase happened without anybody calculating what the previous year produced.
The section works through these decisions in order, beginning with how brands decide which events are worth appearing at and closing with the pattern in which one brand’s build raises what every other brand spends the following year.
The evidence draws on three sources: research interviews, peer-reviewed work on conference and trade show attendance, and industry survey research on current market conditions. Where an account rests on a single interview it is identified as one account, and where published work measures something different from an activation, the difference is stated.
Brands choose where they appear
An agency interviewee working across collegiate championship events described how her clients decide where to activate. The first test is whether the crowd at a property matches the brand's target audience. Where it does not, larger brands generally decline the property, however many people it draws. She described a national cheer championship filling a convention center with roughly 20,000 people and carrying no brand presence at all, because that audience was not the one her clients were looking for.
A second test is whether the brand carries the full cost. She described the championship fan events her agency runs as more appealing to brands because a broadcast partner co-funds the property, which is different from taking a space at a venue and paying for all of it.
If they went to every major competition, they would be very busy. So it’s less on quantity and more, I think, on quality.
Published research on trade show selection describes the same decision in a different setting. Berne and Garcia-Uceda surveyed visitors about how they evaluate which shows to attend and found the criteria resolving into three groups: what the visitor already knows about the show, the marketing objectives of their own company, and the cost they expect to incur [ 112 ]. Their sample was retailers in one country, which limits how far the specific findings travel, and the three-part structure is consistent with what the interviewee described.
Han and Verma surveyed more than 2,500 exhibitors and attendees at trade shows and found each group applying different criteria to the same event. Exhibitors weighed business development and contact generation, while attendees weighed the quality of the experience and what they would learn [ 113 ].
Section 04 records this decision happening across a large sample without naming it. Independent research among exhibitors found 64 percent scaling back their overall presence at events, while 75 percent rated the value of their event programs as excellent or good, a figure that rose eight points in a single year [ 52 ]. Those are brands appearing at fewer events and reporting better results from the events selected.
Audiences choose which events to attend
An internal events manager at a national manufacturer described the same choice from the other direction. Her dealer incentive programs compete with programs run by other manufacturers for the attendance of the same dealers, and the destination is the instrument she uses for attendee motivation. Her team looks for places dealers have not been offered before, taking one group to Croatia in 2026 on that basis. She tracks what competitors are offering through her sales team, and through hoteliers and destination management companies.
They always push our team to be creative and make our customers want to go on our trips over competitor trips.
Research from the Incentive Research Foundation records the same practice across a larger group. Its 2024 Incentive Travel Index found 70 percent of buyers seeking destinations they had not used before [ 117 ]. Its annual attendee preference study, now in its fourth wave, examines which destination features participants respond to, and reports a persistent difference between the destinations participants say they prefer and the destinations sponsors actually book [ 118 ]. The Foundation is funded by the incentive industry, and its samples and methods are disclosed.
The academic literature on conference attendance has modeled this decision since 1997, when Oppermann and Chon set out a participation decision-making process and used the term freedom of choice for the degree to which attendance is discretionary [ 114 ]. Zhang, Leung and Qu refined that model into four groups of factors covering the association & conference itself, personal & business factors, location, and cost [ 115 ].
Mair and Thompson tested a version of that model on delegates at United Kingdom association conferences and found six dimensions in the decision, covering personal and professional development, networking, cost, location, time and convenience, and health and wellbeing. Networking and cost were the two that predicted whether a delegate intended to attend again [ 116 ].
Forrester has run an annual survey of business-to-business event decision makers across three consecutive years, covering more than 200 respondents in 2024, more than 250 in 2025 and more than 400 in 2026. Across those waves it reports competition for attendees intensifying, two thirds of teams working with flat or declining budgets, overall event satisfaction falling 8 percent between 2024 and 2025, and attendees registering later than they used to [ 119 , 120 ]. In the 2026 wave, around half of organizations described their events as performing well, against 38 percent of chief marketing officers [ 120 ].
Section 02 records one measure of how firmly that choice is held. Published benchmarks place no-show rates at free events between 40 and 60 percent, against attendance rates of 90 to 97 percent at paid events [ 70 ].
Inside an event, the choice happens again
A fabrication owner working across championship and concert events described what brands do once they are inside an event together. They compare their own footprint against the ones next to them, and the comparison they use is where the visitors are standing.
Each show, every brand is there looking at each other, kind of scoping out the competition.
On his account, what drives the following year’s budget conversation is a visible line at a neighboring build and none at their own, which every brand present can see without any instrumentation.
He also drew a distinction between brands according to how much attention they command before they build anything. A brand large enough to draw visitors on its name can operate a simpler experience and still fill its space. A brand without that recognition has to put something in front of people that earns their attention on the day.
The materials a brand has to work with is recorded in Section 03, where free samples are the leading reason consumers give for engaging at 60 percent, ahead of branded merchandise at 57 percent and discounts or offers at 52 percent [ 66 ]. Section 07 sets out why depth of engagement rather than duration determines what is remembered, and Section 10 sets out the trade-off between depth and throughput.
No published source measures how attention is divided between competing activations at the same event, and no participant in this research measured it. The account above is one practitioner’s observation of how brands read the floor.
Category exclusivity removes part of the contest
The same interviewee described the contest as easier at some events than others, and the difference is whether competitors in the same category are present. At the sports and music events where he works most often, a telecommunications brand is frequently the only telecommunications brand there, and the same holds in other categories. At a trade show, every exhibitor in a category is on the same floor, and standing out takes considerably more work.
Brands pay for that difference where it is available. Courts examining disputes over World Cup and NASCAR sponsorships found that a contractual category-exclusive position could not be replicated through sponsorship of other properties [ 104 ]. Earlier research identified category exclusivity as the single most important criterion in sponsorship selection [ 105 ], which is a brand paying to remove a competitor from the choice an attendee makes.
One brand’s build resets the others
Two interviewees, one on the fabrication side and one agency-side, independently described a pattern in which one brand’s investment at an event resets expectations for every other brand present.
There’s always kind of a catalyst. One brand comes out big and sets the bar. Then everybody else at the event, next year I’ve got to do this, next year I’ve got to do that.
An agency interviewee described the same dynamic from the client side at a national collegiate championship. She reported her financial services client’s build and budget growing year over year, alongside builds from a telecommunications brand and a beverage brand positioned nearby, and reported her client referring specifically to what the telecommunications brand had installed in its space. She also reported budgets across adjacent activations at the same event rising in parallel.
The pattern is documented at scale at the Cannes Lions International Festival of Creativity. Trade coverage describes media agencies establishing beachfront activations first, then platforms and advertising technology companies, each wave arriving with larger budgets than the one before it, and most recently the creator economy [ 107 ]. The scale that produces is considerable. Reported costs run from approximately $108,000 for a hosted brunch to $4 million for a concert activation, with individual beachfront builds reported at $10 million by 2025 [ 108 , 109 ], and one holding company's 2023 beachside activation grew each year afterward to the point that it was constituted as a separate business unit [ 110 ].
None of that is automatic. The escalation runs on brands treating what their neighbors built as the standard to match, and it continues only while they keep doing that. Coverage of the 2026 festival reported executives questioning whether their attendance produced anything that would not have happened anyway, and noted more of them assessing the cost openly than in previous years [ 111 ].
Expenditure decided this way is a response to a competitor’s build rather than to a measured outcome. Whether it is rational depends on which account of marketing effectiveness is applied.
An analysis of 996 campaigns in the IPA Databank produced the excess share of voice principle, under which sustained investment above a brand's market share correlates with share growth over time [ 18 ]. On that reading, matching a competitor's visible presence is a defensible response. Under a last-click attribution framework the same decision cannot be justified, because no return can be traced to it.
Competitive matching is documented as a budgeting practice. Analysis of actual budget decisions distinguishes analytical rules, meaning baseline optimal spending and adaptive experimentation, from heuristic rules, meaning the advertising-to-sales ratio and competitive parity, where a brand matches a competitor's budget outright or sets share of voice equal to share of market. Tested across eight brands in three categories, the study found some categories relying on heuristics almost exclusively, and reliance rising where certainty about effectiveness was lowest [ 102 ]. Matching is what brands reach for when they cannot measure.
The response is more moderate than a single account suggests. Research covering more than 400 consumer product categories over four years found the predominant competitive response to an advertising or promotion attack is no response at all, and that where a reaction does occur it is typically retaliatory in the same instrument, with advertising answered by advertising [ 103 ]. That fits the accounts collected here, in which a larger build was answered by a larger build rather than by a price move, and in which the response occurred at some events and not others.
None of these studies examines experiential build scale directly. The Databank analysis and the budgeting study concern advertising, and the competitive reaction study concerns consumer product advertising and promotion. They establish competitive matching as a documented component of marketing expenditure decisions and support the mechanism the interviews describe by analogy rather than by direct measurement.
Escalation against the previous year
A further pattern appears in three of the interviews, in which a brand competes against its own previous year rather than against a rival. Nothing in this research measures it, so it is recorded as a pattern rather than a finding.
An agency interviewee described a first-year activation that set the standard for the partnership, and described every year since as an attempt to exceed it in a different way. That escalation is self-imposed rather than driven by a competitor.
The fabrication owner described the reverse position for a brand that has already set the standard, which is that repeating the same execution stops being distinctive and returns the brand to the average of the event. The internal events manager described participants arriving with expectations formed elsewhere, including from itineraries they have generated themselves using artificial intelligence tools, and described a plain room with a buffet and background music as no longer acceptable to them.
Forrester’s finding that overall event satisfaction fell 8 percent between 2024 and 2025 is consistent with expectations rising against budgets that are not [ 119 ]. It does not establish the mechanism, since the survey does not separate expectation from delivery.
Pressure without a competitor
One interviewee in this research described no competitive scanning at all. The direct client running a national membership conference was asked whether she looks at what other associations are doing when deciding what to change about her event. She answered by describing feedback from her corporate members, whose test is whether a week at her conference is worth the cost, and by describing her own budget constraint.
She has no rival in her category competing for the same audience at the same moment. Her event competes against everything else on a member’s calendar and against the cost of a week away, which is the attendee-side choice described earlier without a competing brand on the other side of it. The pressure, in this case, comes from her corporate members and her budget rather than from a rival.
Property selection and build both move the return
Neither the cost pressure described in Section 04 nor the competitive response described here involves an assessment of what an activation returned. Both raise expenditure for reasons unconnected to performance, which is why growth in reported spending cannot be read as evidence that the activity is working.
The same two choices bear on the return itself, one each.
The first choice is the audience's. If an attendee is choosing between builds on the day, then the quality of what is built is the thing that wins or loses that choice for a brand without enough recognition to draw people on its name alone. Section 03 explains why that is more than a presentational matter, finding that the effect of attendance on brand equity ran through the sensory, emotional and behavioral response the event produced rather than through the attendee's considered evaluation of it [ 90 ]. Section 07 takes that further by explaining why a shorter, better experience is remembered more favorably than a longer one, and Section 10 sets out what designing for depth costs in reach.
The second choice is the brand's. Choosing which property to appear at is a decision about how many people will attend and who they will be. Section 09 carries that through, establishing that cost and attendance move the conversion rate an activation must achieve by more than an order of magnitude, before anything about the quality of the experience is considered.
Taken together, this section has shown that both choices are inputs to the return on investment, and both are settled before anything is built, which is why Section 13 places them in scoping rather than in evaluation. The factors involved in these choices are shown in the chart below.
| Who is choosing | What they weigh | Where this comes from |
|---|---|---|
| Brand | Whether the crowd matches the target audience | Research interviews [ 83 ] |
| Brand | How far the property reaches, and whether a broadcast partner is contributing money | Research interviews [ 83 ] |
| Brand | Whether competitors in the same category will be present | Research interviews [ 83 ]; sponsorship research [ 104 , 105 ] |
| Brand | What the brand already knows about the event, its own marketing objectives, and expected cost | Berne and Garcia-Uceda [ 112 ] |
| Attendee | Professional and personal development | Mair and Thompson [ 116 ] |
| Attendee | Networking | Mair and Thompson [ 116 ] |
| Attendee | Cost | Mair and Thompson [ 116 ]; Berne and Garcia-Uceda [ 112 ] |
| Attendee | Location and how easy it is to reach | Mair and Thompson [ 116 ]; Zhang, Leung and Qu [ 115 ] |
| Attendee | Time and convenience | Mair and Thompson [ 116 ] |
| Attendee | How appealing the destination is | Incentive Research Foundation [ 117 , 118 ] |
| Attendee | Whether a competing brand is offering something they would rather accept | Research interviews [ 83 ] |
References for this section: 18 , 52 , 66 , 70 , 83 , 90 , 102 , 103 , 104 , 105 , 107 , 108 , 109 , 110 , 111 , 112 , 113 , 114 , 115 , 116 , 117 , 118 , 119 , 120 .
06 How Events Are Measured, and Where the Data Hands Off
Practice across ten interviews, three event types, and the structural reason the chain separates where it does.
Measurement is detailed up to handover
Across the ten interviews conducted for this research, every participant described measuring throughput or attendance, most described engagement and interaction counts, and several described contact capture. These measures are collected reliably, reported to clients as a matter of course, and in several cases captured in real time.
A production agency leader described three distinct regimes according to event type. At trade shows, clients ask how many leads were captured and how many people came to the booth, and often request dwell time or a heat map of movement within the space. At brand activations, measurement covers throughput, interaction counts, media pickup, and where a deployment runs long enough, patterns across days and weeks. At internal corporate events, the operative measure is delivery against budget.

Dwell time and movement heat maps are the notable entries in that list. Both require deliberate instrumentation, and both describe how an audience behaved rather than how many arrived. Where clients ask for them, the industry supplies them.
Several interviewees described capturing more than was requested.
We'll track things anyway, just to make sure we have it in case they come back later and ask.
That describes a supply side measuring ahead of demand. The data exists before anyone asks for it, which is the condition Section 12 builds on.
Measurement is limited to the footprint
What the collected measures have in common is that all of them describe activity inside the footprint. Each one is observable by the party operating the space. Revenue is not, and neither is what became of a captured lead three months later. Those sit with the brand. The same boundary appears in every account collected here, from fabrication through production to agency.
A director of experiential at a sports and entertainment agency described detailed real-time capture of giveaways distributed, photographs taken and interactions completed, and described passing those raw counts to the client, who combines them with data the agency does not see. The measurement continues somewhere the agency cannot observe.
A business development interviewee described the same shape from the supplier side.
I don't know a lot of people that go through the process of understanding what leads you are getting and then what happens on the back end with those leads.
A fabrication owner working across championship and concert events described receiving no post-event figures and identified repeat commissioning as the signal available to him.
We don't get too much of the post-event feedback numbers and their metrics. We just have to look at whether people keep calling or not.
Repeat commissioning is a real signal. In a market where suppliers are appointed annually and work is won on performance, it is not a weak one. It is a slower and coarser signal than the data the same supplier is already generating.
An agency running fan events for a major financial services sponsor described brand awareness assessment as informal and noted that a survey conducted at her events had been commissioned by a broadcast partner rather than by the brand. Measurement was performed by whichever party held the relationship it served, rather than by the party that built the experience.
The boundary is not technical
Two explanations emerged, and they are complementary and the pattern they explain is long established. Academic work on exhibition performance distinguishes outcome-based sales measures from behavior-based measures such as information gathering, relationship building and image building, and finds that exhibitors evaluate themselves predominantly on the second group [ 21 , 22 ].
The first is positional. The best party to observe behavior during an activation is the production or fabrication partner, and that party sits furthest from the client's commercial data. The party holding the revenue data is the brand, typically two or three organizations removed from the build. The information is generated at one end of the chain and required at the other, and no mechanism currently moves it between them.
We don't get to see the brand lift over time. We don't necessarily get included inside the strategy part of that.
The second is commercial. The same interviewee described a reluctance among intermediaries to bring production partners into earlier conversations, and a comparable caution among brand marketing teams. A business development interviewee described the constraint from the supplier side, noting that approaching an end client directly places at risk the intermediary relationship that generates the work in the first place.
Both positions are rational. An agency's relationship with its client is a commercial asset it is right to protect, and a supplier that jeopardizes that relationship loses the work. The consequence, rather than the intention, is that the party holding the most granular behavioral data sits outside the conversation where objectives and measurement are set.
One account connects the chain
One account in this research describes the chain joined end to end, and it is worth examining closely because it demonstrates what connecting the chain actually requires.
An agency interviewee described a sports association commissioning brand recall studies from an external research agency, repeated annually across four years of a major sports sponsorship, with results reported as positive on each occasion [ 83 ]. The specific figures were not available for publication.
Four consecutive years of repeat commissioning is itself a result. A study returning nothing usable would not have been renewed three times.
The same interviewee described setting a measurable objective as standard practice within her own engagements, and did so on grounds that were organizational rather than analytical.
We don't do an event just to do an event. In the beginning they'll say, well, we just want people to enjoy themselves. That's great, but your boss is going to ask you, what did you achieve?
The decision that made the difference was taken before the activation was designed rather than after it ran. The measurement followed from the objective instead of being fitted to it afterward. That sequence, and not the instrument chosen, is what separates this account from the others collected here.
Section 12 examines what connecting the chain would involve more generally, and establishes that the barrier is not cost.
References for this section: 21 , 22 , 23 , 83 .
07 The Mechanism
Why a shorter, better experience is remembered more favorably than a longer or larger one.
The peak and the ending dominate
If depth of engagement affects outcomes more than duration or scale, a mechanism is required to explain it. The most developed account in the behavioral literature is the peak-end rule, which holds that retrospective judgments of an experience are dominated by its most intense moment and by how it concluded, rather than by its length or by the sum of its parts [ 6 , 7 ].
The effect has been replicated across pleasant and unpleasant experiences and in clinical settings [ 8 ]. A 2022 meta-analysis of 174 effect sizes found the peak-end effect large and robust, stronger than the effect of the opening episode, and confirmed that duration itself has essentially no predictive power for retrospective evaluation [ 9 ].
The practical implication is that experiences are not evaluated cumulatively. A longer experience does not accrue more favorable memory, and a larger one does not necessarily produce a stronger impression. What is retained is a peak and an ending.
A production agency interviewee arrived at the same conclusion from operational experience, describing what happens when one room at a multi-room conference fails technically.
They're not going to remember all the good stuff. They're going to remember, I sat in this room for ten minutes waiting.
Nine functioning rooms are erased in recollection by one that did not function. That account was given without reference to any behavioral literature, and it is the clearest indication in this research that the mechanism operates in practice rather than only in experimental conditions.
Sensory input works below awareness
The design practice that follows treats sensory input as the material of the experience rather than as decoration applied to it. This is well supported. A review of sensory marketing research establishes that sensory input affects perception, judgment and behavior directly rather than only through conscious evaluation [ 10 ].
Controlled studies find that scent attached to a product raises recall of that product's other attributes for as long as two weeks after exposure [ 11 ], and that multisensory description alters perceived taste [ 12 ].
The field study reported in Section 03 offers the closest thing in the published evidence to a direct test of this mechanism, although it was not designed as one. Of the four formats it measured, pop-up shops recorded the highest sensory and affective scores and their weakest score on behavioral response, while sponsored events showed the opposite profile, with behavioral response their strongest dimension. Pop-up shops also produced the largest gain in brand equity of any format, and the steepest relationship between the experience itself and post-event brand equity [ 90 ].
If you want to make something great, come up with the eyes, the ears, the smell, the touch, the taste that wraps everything in a bow.
The same interviewee identified participation rather than spectacle as the operative variable, using the example of a branded kick at a football activation. Performing the action is pleasant and forgettable. The same action accompanied by real-time visual response, sound and the ability to share the result becomes something a participant carries away, because they produced it rather than observed it.
Customization compounds this. An agency interviewee reported that attendees will wait at considerable length for an item they personalize themselves, which is the strongest observed indication of engagement depth anywhere in this research. This is consistent with the engagement data in Section 03, where trial emerges as the leading reason consumers give for taking part at all [ 66 ].
They will wait hours for a custom hat that they can put their own patch on. People love it.
Build quality signals the brand
A fabrication owner described a distinct requirement, which is that a temporary structure must not read as temporary. His account frames build quality as a signal about the brand rather than as an aesthetic preference, contrasting a folding table with a printed cloth against an enclosed environment finished to a standard he compared to a museum installation.
The distinction he draws is that a visitor forms a judgment about the brand from the physical execution before any interaction takes place, and that a visibly provisional structure transfers that impression to the brand it represents.
Time spent matters and is not measured
Every element of this mechanism implies that time spent and depth of interaction matter, yet no participant across ten interviews was able to supply a dwell time figure.
One interviewee stated that they value dwell time and can track this but it is often not requested, on the grounds that his clients want brief interactions and high throughput. It really is case by case by how the interactive is going to be used. Other interviewees treated depth and duration as central to a successful activation without measuring either. The closest proxy recorded anywhere in this research is queue tolerance, and the only observed engagement figure is a participation rate.
The mechanism described in this section therefore rests on published behavioral research and on consistent practitioner observation, but not on measurement from within the industry. Section 10 examines what follows from it, and Section 12 examines what measuring it would require.
References for this section: 6 , 7 , 8 , 9 , 10 , 11 , 12 , 66 , 83 , 90 .
08 Reach, Earned Value and Comparison with Paid Media
What activations deliver against the awareness objective, and how that compares with buying the same exposure through media.
The audience is new and qualified
Brand awareness was the objective cited most frequently across the ten interviews, and in several accounts it was the only objective cited. Before comparing that against alternatives, it is worth establishing what activations do deliver on this measure.
Published survey data suggests that stated objectives are shifting. In the current edition of the principal annual benchmark study, 64 percent of consumer brand marketers now rank media coverage and public relations as their primary event objective, placing it ahead of awareness for the first time. Among business-to-business marketers, the proportion ranking public relations as a leading goal has risen from 25 percent to 53 percent [ 66 ].
The shift indicates that brands are increasingly paying for the press an activation generates rather than for the people who walk through it. That is a different purchase, and it should be evaluated against what coverage costs rather than against what paid reach costs.
Exhibition industry research finds that 67 percent of trade show attendees are prospects the exhibiting company has not previously reached, and that 81 percent hold buying authority for the products on display [ 74 ]. The same body of research reports 59 percent of attendees reaching a purchase decision within three months of an event [ 74 ]. A new audience that can actually buy is difficult to assemble through any other channel.
The question this section addresses is narrower: whether the awareness generated is efficiently purchased at activation prices, or whether the same exposure is available for less elsewhere.
Reach is bimodal, not uniform
The most common justification offered for activation spend is that attendees photograph and share the experience, extending its reach beyond those physically present. Two approaches exist for valuing that reach.
The first applies a cost-per-thousand-impressions rate to estimated impressions. The second prices the volume of organic posts against published rates for paid influencer content, which for nano-tier creators runs at roughly $25 to $150 per post and for micro-tier creators at roughly $150 to $500 [ 73 ].
The second approach asks what a brand would have paid a small creator to produce the same post, then multiplies by the number of attendee posts. It is the sturdier of the two, because the rate card is published and checkable where an impression count is estimated.
Both approaches depend on an estimate of how far an ordinary attendee's post actually travels, and this research produced a considerably lower estimate than the industry generally assumes.
Somebody going to the college football playoff for the first time, their photos would be seen by 10 or 20 people within their small circle, versus an influencer who has 100,000 followers.
That is one practitioner's estimate, offered in conversation rather than derived from measurement, and it should not be treated as a reach benchmark. No participant in this research measured the reach of attendee posts, and no published figure was identified that measures it directly for this context.
What the estimate illustrates is a structural point that does not depend on the specific numbers. Attendee reach is bimodal rather than uniform, since a small number of participants carry substantial audiences while most carry very few. On that basis, volume of posts is a poor predictor of total reach and audience composition matters more than throughput. The magnitude of the effect remains unquantified.
Reach is not spread evenly across a crowd. A handful of people reach thousands while everybody else reaches a dozen. Counting posts therefore says little about how far an activation traveled, and who attended matters more than how many.
The wider literature supports treating volume and value separately. Meta-analyses of electronic word of mouth find a positive but modest average association with sales. Volume elasticity is approximately 0.24 and valence elasticity approximately 0.42 across 51 studies, and the average correlation is 0.09 across 96 studies covering 40 platforms and 26 product categories [ 27 , 28 ]. Word-of-mouth referrals have also been found to carry substantially longer effects than conventional marketing activity [ 29 ].
Elasticity here describes how far sales move when the input moves. A volume elasticity of 0.24 means that ten percent increase in posts is associated with roughly a 2.4 percent increase in sales, and a valence elasticity of 0.42 means that a ten percent improvement in how positive those posts are is associated with roughly 4.2 percent more sales. What people say matters approximately twice as much as how often they say it. The correlation of 0.09 is the more sobering figure, placing the relationship between online conversation and sales as real but weak across a very large body of studies.
A production agency interviewee raised a further objection, questioning whether platform-reported influence figures can be relied upon at all, and suggesting that skepticism about the authenticity of online reach may increase rather than diminish.
An interviewee with a background in customer relationship management offered a more precise account of when paid influencer investment is warranted: where an audience will attend specifically because a named individual is present, and in low-consideration product categories where a recommendation translates directly into a purchase. Neither condition describes the general case for attendee amplification.
Paid exposure costs a fraction as much
The exposure an activation generates can be priced against what the equivalent exposure would cost to buy. Published 2026 benchmarks place connected television at roughly $15 to $40 per thousand impressions for standard inventory and $35 to $65 for premium direct buys, network display advertising at approximately $3.12, and out-of-home formats such as transit shelters at $3 to $5 [ 71 , 72 ].
Cost per thousand impressions is the price of a thousand exposures, so at $3.12 reaching one person costs approximately a third of a cent.
Out-of-home is the closest analogue to an activation footprint. A physical structure situated in a high-traffic location, generating exposure among people passing it, performs the same function as an out-of-home placement. One interviewee described a forty-foot-square footprint in a city plaza past which an estimated thirty to fifty thousand people passed daily, which is an apt description of an out-of-home audience.
Applying published rates to the exposure such a footprint generates produces a media equivalent between roughly a quarter of one percent and 2.7 percent of a flagship activation budget, depending on which medium is used as the comparator. This kind of calculation is a comparator rather than a valuation. The established measurement standards for communications hold explicitly that advertising value equivalents do not represent the value of communication, and the figure is used here to establish what exposure costs elsewhere rather than what an activation is worth [ 23 ].
Expressed in currency, a brand setting out to buy the same number of impressions the footprint generated, and buying nothing else, would spend between approximately $2,400 and $26,000 against a flagship budget of $950,000.

Two calculations based on published rates point in the same direction. Valuing organic posts against published influencer rate cards recovers a small fraction of activation spend, and purchasing equivalent exposure through the most comparable paid medium costs a fraction of one percent of the activation. A third consideration, that ordinary attendee reach may be considerably lower than commonly assumed, is supported by practitioner observation but not by measurement, and is noted rather than relied upon.
Each participant displaces other spend
The comparison above prices an activation on exposure, which is the measure it performs worst on. A more useful comparison asks what a brand no longer has to buy because the activation delivered it.
An activation does not deliver impressions. It delivers identified people, most of whom the brand has not previously reached and most of whom can authorize a purchase. Exhibition research puts those proportions at 67 percent and 81 percent respectively [ 74 ]. That is the commodity brands purchase expensively through every other channel.
A lifted person is someone whose view of the brand changed, rather than someone who was merely exposed to it. Most people who see an advertisement are unaffected by it, so dividing a budget by the smaller number who were affected produces a considerably larger figure than cost per impression, and a more useful one.
Four components of an activation substitute directly for spend committed elsewhere, and each can be priced against its published alternative. Brand lift is the smallest of the four. Reaching a qualified audience through targeted media costs $25 to $50 per thousand impressions rather than the $3.12 of untargeted network inventory, a considered purchase, meaning one the buyer researches rather than makes on impulse, requires eight to ten exposures rather than five, and consideration lift in paid media typically runs at or below one percentage point rather than the three percentage points recorded for ad recall. At $30 per thousand, a frequency of eight and a one-point consideration lift, a lifted person costs approximately $24 through media, rising to approximately $50 at premium rates and a frequency of ten. A working figure of $35 is used below. Where an activation lifts 40 percent of participants, each participant displaces approximately $14 of media spend.
Qualified contact is the largest of the four. Where 60 percent of participants provide contact details, and generating a comparable qualified lead through other channels costs approximately $100, each participant displaces approximately $60. The distinction matters: the acquisition costs recorded in Section 11 are the cost of acquiring a customer, not a lead, and applying them here would assume every captured contact converts. The lead value is the defensible figure, and the revenue that follows from conversion is counted separately in Section 13 rather than folded into this line.
Product trial and research interaction complete the set. A sampling program reaching the same number of people carries its own cost, and the field-experimental work discussed in Section 03 finds effects on purchasing observable up to twelve months afterward. Direct interaction with participants, and the engagement data captured wherever interactive technology is deployed, substitutes for commissioned research. Priced conservatively at $20 and $15 respectively, the four components total approximately $109 per participant.
Google Ads reports cost per lifted user, dividing the total cost of a campaign by the number of lifted users, and defines it as the cost of changing someone's mind about a brand on awareness, ad recall or consideration [ 99 ]. Meta reports cost per brand lift, dividing the budget spent reaching the exposed group by the total brand lift, which gives the cost of each incremental person who supplied the desired response [ 100 ].
Because activation cost is fixed and displacement accrues per participant, the two can be set against each other to establish how many participants an activation must reach before avoided spend alone recovers its cost. Neither side was measured in this research, so both are modeled from published rates and stated assumptions.
Breakeven attendance is activation cost divided by displaced spend per participant. At $109, a flagship activation at $950,000 recovers its cost at approximately 8,716 participants. Mid-tier work at $325,000 recovers at approximately 2,982, and the permanent installation at approximately 4,587 against the 8,828 it in fact recorded.
Worked through on the media figure, reaching one person at a targeted rate of $30 per thousand costs approximately three cents, and reaching that person the eight times a considered purchase requires costs approximately twenty-four cents. Roughly one in a hundred of those people shifts their consideration, so the cost of one who did is approximately $24. An absolute lift of one point means consideration rose from, for example, 20 percent to 21 percent among those who saw the campaign.
The flagship package described in this research drew between 1,000 and 6,000 participants across two days, which places it below the displaced-spend breakeven on attendance alone. The four-deployment structure examined in Section 09, at $1,000,000 across 16,000 participants, clears it by a factor of 1.7. The permanent installation clears it by a factor of 1.9.
That is the amortization finding of Section 09 expressed in a second form. Activation cost is committed once while displacement accrues per head, so the number of deployments a single build serves determines whether avoided spend covers the investment. The 40 percent lift rate applied to activations is far above the three percent applied to media, because standing inside something is more persuasive than seeing an advertisement, and that advantage is already built into the figures below.
| Component | Basis | Displaced per participant |
|---|---|---|
| Brand lift | 40 percent lifted, $35 per lifted person | $14 |
| Qualified contact | 60 percent capture, $100 per qualified lead | $60 |
| Product trial | Sampling program equivalent | $20 |
| Research interaction | Commissioned research equivalent | $15 |
| Total displaced | Per participant | $109 |
| Deployment | Cost and attendance | Position against breakeven |
|---|---|---|
| Flagship, two days | $950,000, 1,000 to 6,000 | Breakeven at 8,716 |
| Four deployments, one season | $1,000,000, 16,000 | Covered 1.7 times |
| Mid-tier | $325,000, 2,000 | Breakeven at 2,982 |
| Permanent installation | $500,000, 8,828 | Covered 1.9 times |
Two components of the bundle cannot be purchased at any price. Ninety-five percent of attendees reported trusting a brand more after taking part in an in-person event, in a period when 71 percent of brands recorded corporate reputation declining through other channels [ 86 ]. In a controlled study, identical requests made in person succeeded 34 times more often than the same requests sent by email [ 93 ]. Neither is costable and both belong in the assessment.
Two to three orders of magnitude is between 100 and 1,000 times. Even crediting the activation with a lift rate more than ten times higher than the one applied to media, it remains substantially more expensive per person persuaded, because far fewer people can physically attend.
The lead value carries 55 percent of the displaced total and is the input to establish first, since a commissioning brand holds its own cost per qualified lead and can substitute it directly. The 40 percent lift rate is the softest input, because no participant measured brand lift at an activation and no published study measures it for this format, but at $14 per participant it moves the total by less than fifteen percent in either direction.
Every assumption in the calculation can be moved in the direction that favors the activation without altering the conclusion, which is what makes the comparison worth stating.
Retained lift is highly uncertain
Duration is the variable on which the comparison could reverse, because the two are not bought on the same horizon. Section 03 records the only duration evidence available: 47 percent of working professionals reported a positive perception lasting a few months or longer, and 18 percent six months or more [ 86 ].
Those two readings permit a decay curve to be fitted, and the shape selected determines the answer. Treating the intervals as three months and six months, an exponential decay implies a half-life of approximately 2.2 months and projects 0.4 percent of the initially lifted group still holding the perception at eighteen months. A power-law decay fitted to the same two points, which is the form the memory literature more commonly supports, projects approximately 3.9 percent.
The two forms describe different patterns of forgetting. Exponential decay assumes a steady rate, with half the remaining group forgetting every 2.2 months. Power-law decay assumes forgetting slows over time, so whoever still holds the perception at six months is likely to hold it for some period afterward. The first leaves almost nobody at eighteen months and the second approximately one person in twenty-five.
The two projections differ by an order of magnitude, and the underlying data cannot distinguish between them, because two observations cannot identify a curve. Eighteen months is also three times the longest interval the source measured, so both figures are extrapolations beyond the evidence and are presented as bounds rather than as estimates. A further assumption is embedded in both: the reported durations describe professionals who registered a perception change at all, and are applied here to the modeled lifted group.
Two observations cannot fix a curve, so the defensible position is a range with both ends stated rather than a single figure that carries the appearance of measurement. Applied to the flagship activation at 3,000 participants and an assumed 40 percent lift, 1,200 people are lifted at the outset, approximately 564 remain at three months and approximately 216 at six months. At eighteen months the range is between roughly 5 and 47 people, and the cost per person still holding the perception is between approximately $20,000 and $190,000.
Duration therefore affects the brand lift component of the bundle, which is the smallest of the four at $14 per participant, and leaves the contact, trial and research components unaffected. Contacts do not decay. That is a further reason the case for an activation should not be built on lift alone.
Attendance decides if it covers cost
Activations generate awareness among an audience that is largely new to the brand and largely qualified to buy. Priced on raw exposure, they compare poorly, because exposure alone is available far more cheaply and an impressions comparison assesses an activation on the measure where it competes least well. Priced on what a brand no longer has to buy, the position reverses at sufficient attendance.
Advertising sells exposure and nothing else, which is why it sells exposure cheaply. An activation sells participation, so pricing it on exposure means competing on the single measure the alternative performs best.
This has a practical consequence for how activations should be evaluated. A brand already at high prompted awareness has limited room for incremental gain, and cannot purchase what does not exist to be purchased at any price. A brand new to a market has considerably more, which is consistent with the one case in this research where formal recall measurement was commissioned: a financial institution establishing itself in a market where it had recently opened branches.
A brand almost everyone has already heard of cannot buy much additional awareness whatever it spends, while a brand entering a new market can.
Displaced spend establishes the floor. What sits above it is conversion revenue, and Section 09 examines what the research allows to be calculated there, with Section 13 setting out how a brand assembles the two into a single return figure.
References for this section: 23 , 27 , 28 , 29 , 66 , 71 , 72 , 73 , 74 , 83 , 86 , 93 , 99 , 100 .
09 Cost, Attendance and the Breakeven Question
What the research allows to be calculated, what it does not, and how to frame the question so the missing input becomes visible.
Two of three inputs are available
Evaluating an activation financially requires three inputs: what it cost, how many people it reached, and what proportion of those became customers. This research supplies the first two and not the third. This is not the only basis on which an activation can be assessed. Section 08 prices the spend an activation displaces, which recovers cost without reference to conversion at all, and Section 12 sets out what establishing the third input directly would require. The framework used here is the one the available evidence supports.
The conversion question was included in the interview guide and asked in every conversation. Across ten interviews spanning agency intermediaries, a fabrication partner, a direct client and three senior leaders at a production agency, no participant could supply a conversion rate from attendee to customer, and none had visibility of one held by a client.
Cost per attendee varies tenfold
Dividing cost by attendance produces the only figure in this analysis derived directly from the research inputs. The range it produces is wide enough to require explanation.
A single interviewee described a flagship package at $900,000 to $1,000,000, covering on-ground build, digital and social content and talent integration, with attendance across a two-day activation ranging from roughly 1,000 to 6,000 people depending on how extensive the experience was and how quickly visitors moved through it.
Those figures alone produce a cost per attendee between approximately $158 and $1,000, a spread of more than six times, from one source describing one type of activation.
Adding the other tiers widens it further. Mid-tier activations described at $250,000 to $400,000 imply figures in the low hundreds. Entry-tier work at $80,000 to $100,000 implies figures in the tens. A nine-month permanent installation reporting 8,828 participants produces a materially lower cost per participant than a two-day activation of comparable investment, because the cost amortizes across a season rather than a weekend.
The same effect operates across deployments as well as across time. A total commitment of $1,000,000 spread over four two-day deployments in a single season, drawing 4,000 participants at each, produces 16,000 participants at a cost per participant of $62.50. The flagship package described in this research committed a comparable sum to a single two-day activation and produced between 1,000 and 6,000 participants, at $158 to $1,000 each.
The difference is amortization rather than efficiency in delivery. Where a brand is committing at flagship scale, the number of deployments a single build serves affects cost per participant more than any decision about the size of the budget. The attendance figures above are illustrative; the relationship they demonstrate follows from division alone.
These tiers describe total commitment rather than headline fees, and the distinction is not always made at the point of budgeting. A widely used industry framework places total trade show cost at approximately three times the exhibit space fee, and finds that most exhibitors underestimate their total costs by twenty percent or more [ 53 ].
A fabrication interviewee described the same effect from the client side, reporting brands arriving with a figure in mind that does not include all of the additional costs like shipping, handling, storage and space rental. Any cost-per-attendee calculation built on the visible fee alone will understate the denominator substantially.
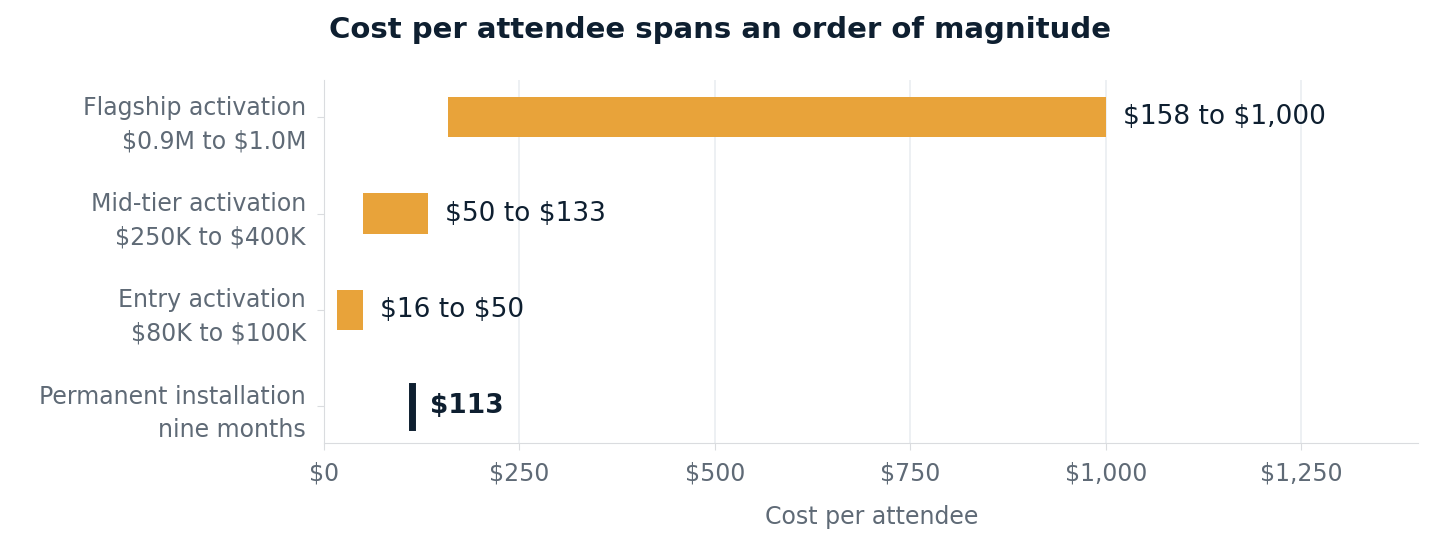
Attendance varies more than cost
A fabrication owner working across championship and concert events described a weak year at a college football championship drawing one to two thousand people a day, larger championship events drawing ten to twenty thousand a day, and concert activations running at capacities of three to five thousand.
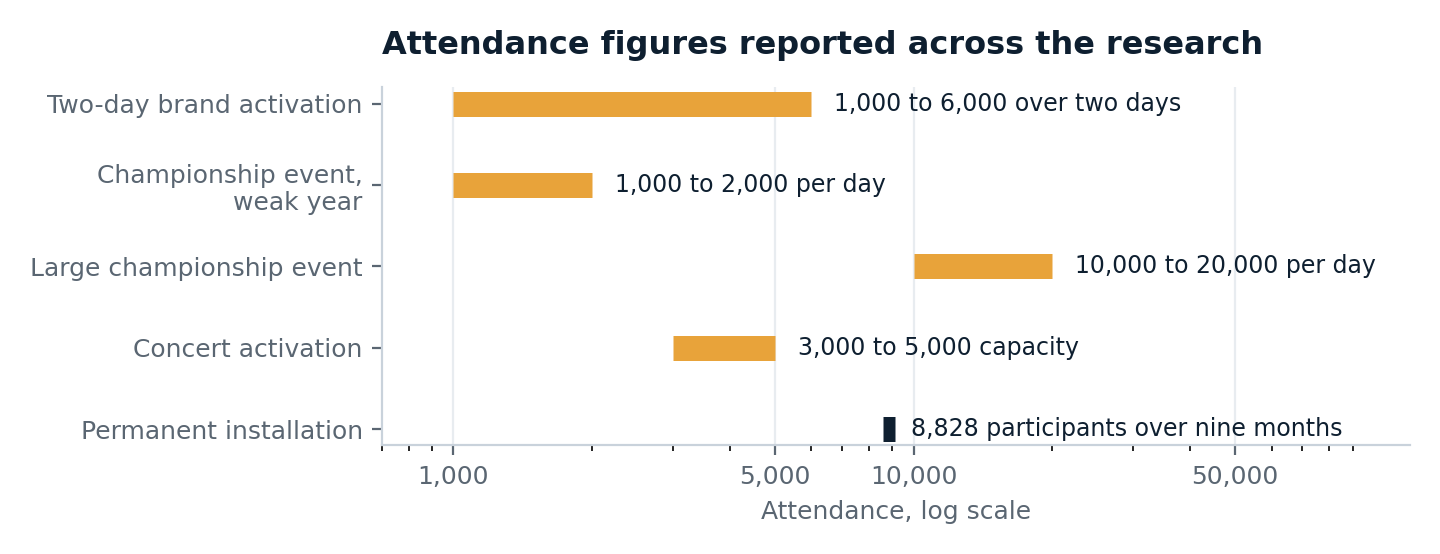
That distinction matters for any cost calculation. Passing traffic, footprint entries and completed participations are three different populations, and interviewees used attendance language for all three.
The permanent installation is the only deployment in this research where the difference was recorded: 31,970 entries produced 8,828 participants, a participation rate of 27.6 percent. The entry count includes staff movements and visitors who looked in without taking part, so the participation rate among genuine visitors is somewhat higher.
Reach cost is not acquisition cost
Cost per attendee measures the cost of reaching a person present at an event. It does not measure the cost of acquiring a customer. Converting between the two requires knowing what proportion of attendees subsequently purchase, which is the input no source in this research was able to provide.
We measure more so fan attendance throughput at our activations, how many people are coming up to engage. So more so attendance numbers and engagement numbers.
Published consumer research addresses a related but distinct measure. The current edition of the principal industry benchmark study reports that 61 percent of consumers are more inclined to purchase after attending an event [ 66 ]. Inclination is a statement about disposition. It is not a rate at which transactions occur, and treating it as one produces a conversion assumption with no basis in observed behavior.
Dividing a known cost by an assumed conversion rate produces a cost-per-customer figure that carries the precision of the cost input and the uncertainty of the assumption. Across the plausible range of conversion rates the result moves by an order of magnitude, and a reader has no independent basis on which to judge which end of that range applies.
Conversion research sets rough bounds
Although no interviewee could supply a conversion rate, published research sets bounds on what is reasonable to expect, and those bounds are useful even though none of the available studies measures the same population as this analysis.
Business-to-business exhibition research is the most developed. Exhibition industry research reports that exhibitors typically convert approximately 20 percent of qualified show leads into customers within six months, and that 81 percent of trade show attendees hold buying authority for the products on display [ 74 ]. Analysis of business-to-business event pipeline data recorded in-person event close rates averaging 12.1 percent across 2025 [ 75 ].
Two qualifications limit how far these transfer. Both measure conversion from lead to customer rather than from attendee to customer, and a lead is an attendee who has already identified themselves and expressed interest, so the attendee-level rate is necessarily lower. Both also describe business-to-business purchasing, where attendance is itself a professional decision made in advance, rather than consumer footfall at a public activation.
The field-experimental work on sampling discussed in Section 03 adds a further constraint. Its decomposition of apparent effect into acceleration, expansion and cannibalization means that any observed conversion following an activation overstates incremental conversion by an unmeasured margin. This applies equally to the calculations below.
Solve for conversion, don't assume it
Instead of assuming a conversion rate in order to produce a return figure, the calculation takes customer lifetime value, which the commissioning brand already holds, and solves for the conversion rate required to break even.
Activation cost divided by the product of attendance and customer lifetime value gives the proportion of attendees who must become customers for the investment to recover its cost. The output is a single percentage a brand can assess against its own experience.
| Activation | Customer worth $100 | $500 | $2,000 | $15,000 |
|---|---|---|---|---|
| Flagship, $950K, 4,000 attendees | Not achievable | 47.5% | 11.9% | 1.6% |
| Flagship, $950K, 6,000 attendees | Not achievable | 31.7% | 7.9% | 1.1% |
| Permanent installation, $1M, 8,828 | Not achievable | 22.7% | 5.7% | 0.8% |
| Mid-tier, $275K, 4,000 attendees | 68.8% | 13.8% | 3.4% | 0.5% |
| Entry, $100K, 5,000 attendees | 20.0% | 4.0% | 1.0% | 0.1% |

Three observations, no assumptions
The table supports three observations. Each follows from the cost and attendance figures alone, and none depends on an assumption about conversion supplied by this report.
The first is that in high-value categories the requirement is modest. Where a customer is worth $15,000, breakeven at flagship scale requires 1.6 percent of attendees to convert, and at entry scale 0.1 percent. Against published lead conversion of approximately 20 percent for business-to-business exhibitions, these are undemanding thresholds. Practitioners in this research described such rates as achievable, although none was able to confirm the figure against measured data.
The second is that low-value categories cannot support high-cost activations at rates consistent with any published evidence. A brand whose customer is worth $500 would need to convert 47.5 percent of everyone attending a flagship activation. Published lead-to-customer conversion for business-to-business exhibitions runs at approximately 20 percent, and attendee-to-customer conversion is necessarily lower, since only a proportion of attendees ever become leads [ 74 ]. Recorded close rates for in-person business events average 12.1 percent [ 75 ]. The only engagement figure observed directly in this research, the proportion of passing traffic that participated at all, was 27.6 percent.

The third is that cost and attendance move the requirement far more than most discussions of event return acknowledge. A customer value of $2,000 requires an 11.9 percent conversion at flagship scale with low attendance, and 1.0 percent at entry scale with higher attendance. That is a twelvefold difference produced entirely by decisions about budget and throughput, before anything about the quality of the experience is considered.
The third observation appears to favor scale over depth. Section 10 examines this in more detail.
References for this section: 13 , 53 , 66 , 74 , 75 , 83 , 84 . Breakeven calculations are derived arithmetically from the cost and attendance inputs and contain no assumed conversion rate.
10 Depth Against Throughput
The trade-off between how many people an activation reaches and how deeply it engages them.
Attendance and depth are not independent
The breakeven analysis in Section 09 implies that reaching more people at lower cost improves the economics. Practitioner accounts complicate that conclusion, because attendance and engagement depth are not independent variables. Moving people through an experience faster increases attendance and reduces the depth of each interaction.
Interviewees divided on which side of that trade-off to optimize, and did so explicitly.
An agency director working with large consumer brands described designing deliberately for speed, on the basis that attendees want brief interactions, and stated that dwell time is not tracked in his work because it is not a factor his clients value.
A sponsorship consultant took the opposite position, and stated it in terms of a direct trade.
I would rather have an incredible, excellent top-tier experience and only 1,000 people go through it, because then the impact is greater. People are then talking about your brand online, posting about the experience in a positive and praising manner.
He described having observed both approaches and reported that activations optimized purely for throughput generated poor feedback from attendees despite appearing successful on attendance measures, while more considered activations achieved lower numbers and more meaningful engagement.
A fabrication owner declined to choose between them, identifying advantages on both sides and introducing a third consideration: that a targeted approach reaching a smaller number of high-reach individuals can generate greater total amplification than a mass approach. He described a financial services client operating both models at once, running a general access area alongside a separate space for existing customers.
One nine-month deployment, observed
The permanent installation provides the only observed evidence on this question in the research, and it comes from staff who worked the space across a nine-month deployment.
Their reporting records that groups of fewer than ten participants had the best experience, and that overcrowding, particularly during holiday periods, made the activation feel rushed and noisy [ 84 ]. It also records that long wait times caused visitors to leave before experiencing the activation at all [ 84 ].
That last observation is the important one. Beyond a certain volume, additional throughput does not convert into additional participation, because the queue itself becomes a deterrent. Attendance and participation diverge, and the divergence is invisible to any measure that counts entries.
This is well established in the retail environment literature, which provides a mechanism. Perceived crowding, whether arising from the number of people present or from restricted space, has repeatedly been found to reduce satisfaction, and the effect operates through the emotional response it produces rather than directly [ 24 , 25 ].
Perceived control over the encounter moderates the effect, which is why queue management and clear instruction matter as much as capacity itself [ 26 ]. The relationship is not linear: at low levels a degree of human density can raise the sense of occasion, while beyond a threshold it degrades the experience sharply [ 25 ].
Outcomes may be closer than attendance
If deeper engagement produces higher capture and conversion rates, and higher throughput produces lower ones, the two effects work against each other. Modeling both conditions with capture and conversion rates informed by consumer purchase-intent research produces a result worth stating carefully.

At these illustrative rates, a depth-optimized activation reaching a quarter as many people produces a comparable number of converted customers. This is a demonstration of how the arithmetic behaves under stated assumptions, not a measured finding, and the assumptions are precisely the ones this research could not verify.
What gives the result some weight is that it was reached independently by two practitioners on the basis of experience, is consistent with operational data from a third source, and has a behavioral mechanism described in Section 07 that explains why it would hold. What it lacks is measurement.
The two findings do not conflict
The two findings are not in conflict. Section 09 establishes that cost and attendance determine what an activation must achieve. This section establishes that design determines how likely it is to achieve it.
A brand can therefore reduce its breakeven requirement by spending less and reaching more, and simultaneously reduce its probability of meeting that requirement by degrading the experience in the process. Neither consideration overrides the other, and the research does not support a general rule about which dominates.
What the research does support is that the trade-off is currently made implicitly. No interviewee described a client specifying a target dwell time, an engagement depth, or a maximum acceptable queue length. Throughput is measured, depth is not, and what is measured tends to be what gets optimized.
References for this section: 24 , 25 , 26 , 66 , 83 , 84 .
11 Categories, Customer Value and Where Events Fit
What a customer must be worth for the economics to work, and which categories that describes.
Lifetime value decides it, and is absent
The breakeven calculation requires customer lifetime value, and unlike conversion, this is a figure most brands already hold. The method for deriving it is well established: lifetime value is the discounted stream of margin a customer generates across the expected duration of the relationship, and it can be estimated from publicly available information for a listed company using a simple formula [ 30 , 31 , 32 ].
Yet lifetime value did not appear in any account of how activations are commissioned. A business development interviewee described briefs arriving as defined requirements at defined venues rather than as objectives connected to customer economics, and characterized the resulting position as one where the full commercial picture is never assembled by anyone in the chain.
Acquisition costs vary by category
Published customer acquisition costs establish what a brand pays through other channels, and vary widely by category. Travel is estimated at approximately $7 per acquired customer, retail at $10, consumer goods at $22, and arts and entertainment at $21. Paid social acquisition ranges from roughly $20 to $39 depending on sector, and ecommerce search acquisition sits near $70 [ 76 ].
Financial services is the significant exception. Industry association estimates place the cost of acquiring a single new checking account at well over $200, with 43 percent of institutions offering cash incentives averaging $277 in 2025 and market offers clustering between $100 and $500 [ 77 , 78 ].
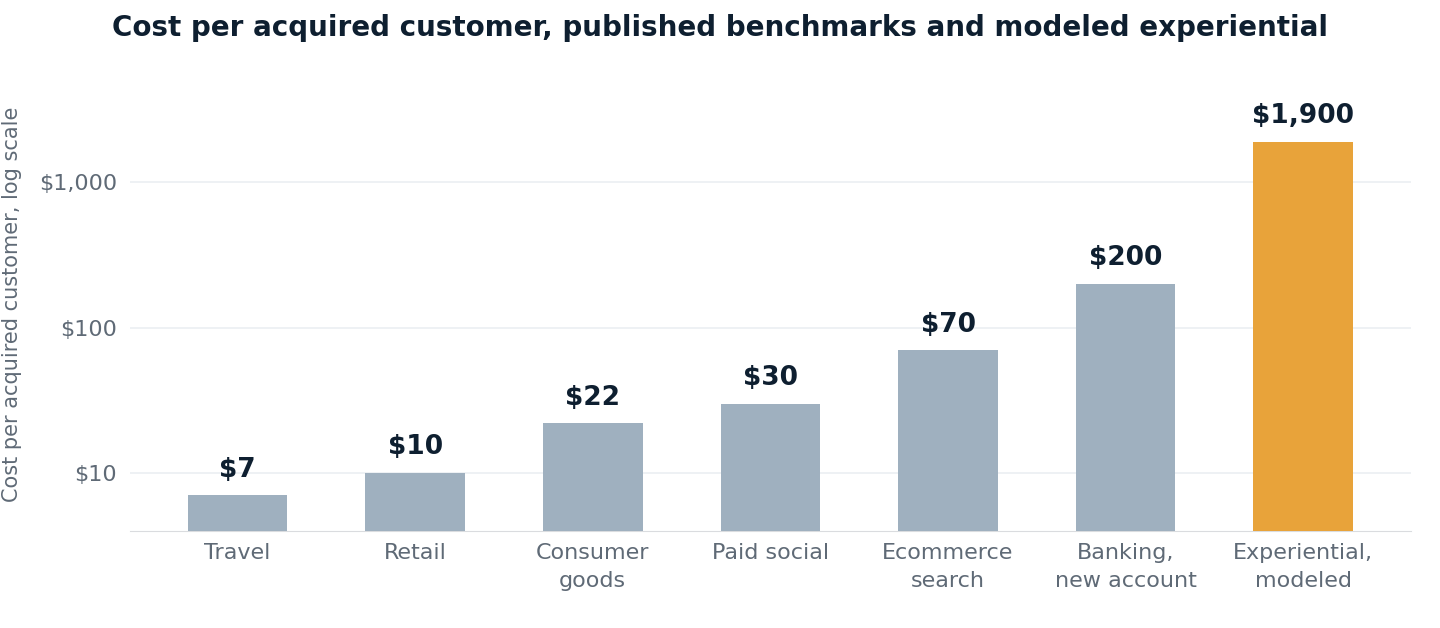
These figures are not directly comparable to an activation. Paid search acquisition records the cost of capturing a customer who already had the need and went looking. An activation is performing a different function, creating consideration among people who did not arrive with an intention to buy. Setting a demand-creation cost against a demand-harvesting cost and declaring the lower one more efficient compares answers to different questions.
A second qualification is mechanical. Paid acquisition cost currently runs between 2.4 and 3.1 times blended acquisition cost across most categories [ 76 ], which implies that the majority of customers arrive through channels carrying no direct media cost per acquisition. Those channels consume brand investment that is rarely charged against the customers it produces, so the low benchmark figures are partly underwritten by expenditure that appears nowhere in their own calculation.
No evidence of more valuable customers
It is frequently asserted that customers acquired through live experience are more engaged and ultimately more valuable than customers acquired digitally. This report does not make that claim, because the available research does not support it.
A study using household panel data from a subscription television service found that customers acquired through free trials showed systematic behavioral differences, ultimately producing average lifetime value 59% below that of regular customers [ 33 ].
A separate analysis comparing acquisition methods against lifetime value found keyword advertising producing the highest mean value and word of mouth performing at average, with the proposed explanation that search is goal-directed and self-selected [ 34 ].
Both findings indicate that low-friction acquisition attracts people who respond to low friction, and that channels requiring a customer to declare an existing intention tend to produce better customers.
What the evidence supports is narrower. The operative variable appears to be the commitment required to participate rather than the channel itself. Traveling to a venue, waiting, taking part and providing contact details are costly actions, and costly actions carry information that a click does not.
The corollary is that an activation designed purely for throughput, with minimal interaction and no barrier to participation, should not be expected to produce committed customers, because it has selected for nothing.
The permanent installation illustrates this directly. It operated free of charge with open access, recorded 8,828 participants, and recorded a repeat visitation rate of 2.2 percent. High reach, minimal commitment, limited evidence of durable attachment. Staff reporting from the same deployment records visitor resistance to providing contact details on the grounds that the experience was free.
Financial services and telecoms lead
Returning to the breakeven table, the categories that can support activation cost are those where a customer is worth enough that a low single-digit conversion rate recovers the investment.
A primary banking relationship held across a period of years generates revenue through account fees, lending, deposits and cross-sold products. Telecommunications contracts behave similarly.
Sports organizations occupy the strongest position. One analysis estimates a highly engaged fan spending approximately $1,500 annually across tickets, merchandise, concessions and related categories, producing roughly $15,000 over a decade, with season ticket holders estimated substantially higher [ 79 ].
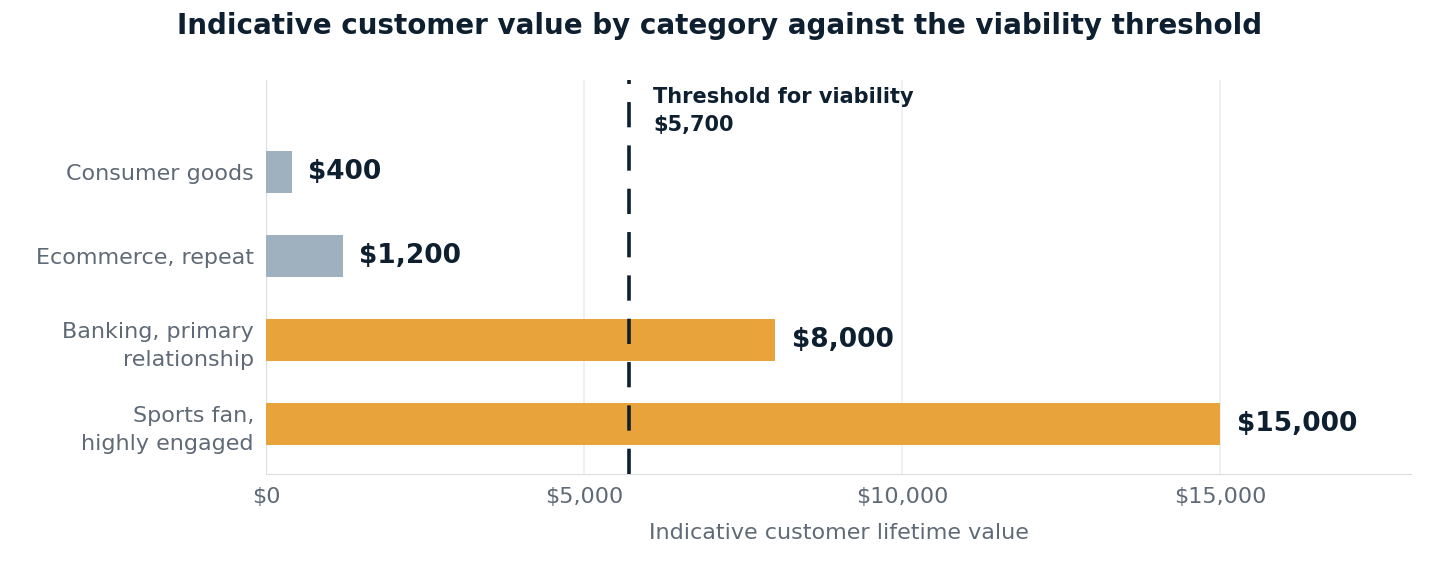
Fan relationships also exhibit unusual durability. Retention analysis in sports indicates that acquiring a new fan costs five to seven times more than retaining an existing one, and that improvements in retention translate into disproportionate profitability gains [ 79 ]. A sponsorship consultant described that attachment without reference to any financial measure.
Sport is the one thing that can unite people, bring people together, regardless of what your differences are. There's a lifelong attachment there.
The interview base fits the analysis
The client bases described in these interviews cluster in the categories the preceding analysis identifies as viable. Of the six external interviewees, three worked primarily with financial services clients and a fourth described a telecommunications brand as a recurring anchor client. No interviewee described a sustained experiential program for a low-value consumer category.
No participant articulated the underlying economics described above, and no question in the interview invited them to, which is what makes the alignment worth recording. The pattern emerges from the composition of the client bases described, not from any account of why those clients commission the work. Practice appears to have sorted toward categories where the arithmetic holds, without the arithmetic being stated in advance. The sample size is small and was not assembled to represent the market, so this corroborates the analysis rather than testing it.
One case in this research sits outside that structure, and it is the closest thing here to a comparison. The direct client interviewed for this research runs an event where every attendee pays to attend, through sponsorship, exhibitor space or an individual pass. The measures it tracks follow from that: completed one-to-one meetings, meet-and-greet volume, survey feedback, corporate member retention and the growth of member businesses. Those are outcome measures, and they sit on the far side of the boundary at which every other account in this research stops.
The explanation is not that this organization measures better than the others. It is that it commissions the event, runs it and collects the revenue, so nothing has to pass between companies for the complete result to be known. Every other account in this research describes a brand at one end and an agency or production partner at the other, with attendance data held by one and revenue data by the other. Remove the split and the measurement follows. The gap is a feature of the arrangement rather than of anyone's capability, and an arrangement can be changed.
References for this section: 18 , 30 , 31 , 32 , 33 , 34 , 76 , 77 , 78 , 79 , 83 , 84 , 85 .
12 How Measurement Could Work
Available methods, what they cost, and the capability already deployed and unused.
Use the data the activation already produces
The measurement gap described in Section 06 is not primarily a technical problem. Interactive installations of the kind commonly deployed at activations already capture individual-level engagement data as a by-product of operating: which activity a visitor took part in, what content they viewed, how they progressed through an experience. That data is generated at every deployment that uses interactive technology, and at most of the activations it is discarded when the activation ends.
Contacts are bought, follow-up is nearly free
Contact capture is treated across the industry as an outcome. It is an input. The value of a contact is realized when somebody uses it, and the cost of acquiring it has already been paid for by holding the event.
The arithmetic is unforgiving. A flagship activation at $950,000 reaching 3,000 participants, capturing contact details from 60 percent of them, produces 1,800 contacts at $528 each. Where those contacts receive nothing afterward, the brand has paid $528 a name for a list it does not use.
Industry sources widely place the proportion of event leads receiving no follow-up at four in five. On that rate, 1,440 of those 1,800 contacts are inert and approximately $760,000 of the activation budget is forfeited after it has been spent. The four in five figure is attributed to exhibition industry research and this report was unable to trace it to a primary publication, so it is carried as an industry claim rather than a verified benchmark.
What separates follow-up from every other method in this report is that it has no cost to recover. A brand lift study has to justify $15,000. A holdout market forfeits the commercial activity held back. An email costs cents against a contact already bought at $528. There is no hurdle to clear, which means any conversion at all is accretive.
At a customer worth $2,000, converting one percent of 1,440 unworked contacts returns $28,800, and 2.5 percent returns $72,000. At a customer worth $15,000, the same rates return $216,000 and $540,000. Those are returns against a marginal cost close to zero, on a budget already committed and already spent.
Speed determines how successful follow-up is. Research published in Harvard Business Review audited 2,241 United States companies using test enquiries and recorded an average response time of 42 hours among those that responded at all, with 23 percent never responding. A parallel analysis of 1.25 million leads across 42 companies found that contacting within an hour made a firm nearly seven times more likely to qualify a lead than waiting one further hour, and more than sixty times more likely than waiting a day [ 101 ]. That research measures inbound web enquiries rather than event attendees, and the mechanism it describes is the one Section 08 sets out: an effect that begins decaying the moment it is created.
Section 08 places the decay of an activation's effect at roughly half the initially affected group within three months. Follow-up is the only intervention available that acts on the effect while it is still present, and the only one whose timing is entirely within the brand's control.
A production agency interviewee described the capability in operational detail, together with what could be done with it: follow-up communication referencing the specific activity a person completed and the specific content they engaged with, rather than a generic acknowledgment of attendance.
There's just a massive void from the experiential standpoint of how to follow up. We have the data that's built into it. We just have to have somebody that wants to drive that far.
Asked whether any client had taken this up, he reported that it had been raised and not pursued.
Response to follow-up is also a measurement signal, and a good one. Section 11 establishes that the commitment required to participate predicts customer value more reliably than the channel does. A person who replies to a follow-up has taken a second costly action, which selects on the same basis as attending in the first place. That signal is free to collect and is currently collected by almost nobody.
Follow-up meets the same boundary Section 06 describes. The party holding the captured contact is frequently the agency or the production partner, and the party able to act on it commercially is the brand. Where the handover is not specified at commissioning, a contact is captured by one organization and actioned by none.
A study costs a fraction of the activation
Where an activation's effect on brand metrics needs to be established rather than inferred, the standard instrument is a control-exposed study measuring awareness, recall, consideration or purchase intent between a group exposed to the activity and a matched group that was not.
The case for randomization rather than statistical adjustment is unusually well evidenced. One study ran fifteen large advertising campaigns as randomized experiments, then re-estimated the same effects from the same data using observational methods, across 500 million user-experiment observations and 1.6 billion impressions. The observational estimates did not reproduce the experimental ones, even after adjusting for extensive demographic and behavioral variables, and they overstated effectiveness more often than they understated it [ 35 ].
Related work establishes how large a sample an experiment requires to detect advertising effects reliably [ 37 ], and how eligibility-based designs can supply a valid control group at low cost [ 38 , 39 ]. More recent research proposes learning from a sample of randomized tests to predict incremental effect for campaigns that were not randomized [ 36 ].
A business development interviewee described such studies as prohibitively expensive on the basis of prior experience, and reported being unaware of any agency positioning them for clients. Published pricing indicates the cost has fallen substantially since.
Tiered third-party brand lift studies are published at roughly $7,500 to $15,000 [ 80 ]. Platform-native studies require a media spend threshold rather than a fee, and the threshold varies by platform from approximately $5,000 on one video platform to six figures on another, with $25,000 to $30,000 the common range [ 99 , 100 ]. The threshold functions as a statistical power requirement, since the platform needs sufficient exposed users and completed surveys to detect an effect above noise.
Analysis of a streamlined measurement workflow recorded external per-study costs falling from approximately $5,000 to $1,700, with internal setup time reduced from 35 hours to under six [ 81 ].

Against a flagship activation, formal measurement represents under two percent of budget. Against a mid-tier activation it is around five percent. Only at entry tier does it become a material proportion of total spend.
Expressed as a budget line, an activation of $1,000,000 carrying $50,000 for measurement allocates five percent, sufficient for formal studies across four markets together with the analysis required to compare them. That places measurement alongside rights fees, build, show services and staffing as a line of the same kind.
Cost is not the explanation for why measurement does not happen. The interviews point to organizational causes: the party best placed to observe is outside the strategy conversation, the party holding revenue data is several organizations removed from the build, and no one in the chain holds both the visibility and the mandate.
Set pre-show objectives, get better outcomes
Exhibition industry research finds that 91 percent of exhibitors who set measurable pre-show marketing objectives reported that their efforts met or exceeded expectations. The same research finds that only 10 to 15 percent of exhibitors invest meaningfully in pre-show activity, and that roughly 5 percent of event budgets are allocated to it, despite 75 percent of attendees deciding which exhibits to visit before they arrive [ 82 ].
Five decisions made before the build
Nothing in this research suggests that measurement requires new technology. It requires five decisions made before an activation is built. The direction is endorsed from within the industry: the 2025 Freeman research recommends explicitly that brands move beyond return on investment to a broader set of objectives including awareness, satisfaction, retention and market expansion [ 86 ].
- Establish customer lifetime value at the briefing stage, and calculate the breakeven conversion rate the activation must achieve. This is arithmetic, it uses figures the brand already holds, and it takes minutes.
- Specify what will be captured during the activation and who will hold it. Where interactive technology is deployed, individual-level engagement data exists by default and requires only a decision to retain and use it. The restraint is consent rather than collection: research finds that roughly 30 percent of consumers will share an email address with no incentive at all, and that this rises to approximately 90 percent where an appropriate value exchange is offered [ 41 ], a pattern consistent with longer-standing work on the trade-offs consumers make when disclosing personal information [ 40 , 42 ].
- Specify who follows up, how quickly, and with what. The contact has already been paid for and the marginal cost of using it is close to zero, which makes this the highest-return decision on the list. Where an intermediary captures and a brand converts, the handover has to be agreed before the activation runs rather than negotiated after it.
- Decide whether the design is optimized for depth or for throughput, and record the decision. Both are legitimate, and Section 10 sets out the trade-off, but the choice is currently made implicitly.
- Budget for measurement as a line item. At flagship and mid-tier scale a formal study is a small fraction of the total, and its absence is a choice rather than a constraint.
A sixth consideration applies to any measured result. The sampling literature discussed in Section 03 establishes that observed post-activation purchasing includes purchases that would have occurred regardless. Where incremental effect matters, a control group is required, and this is the difference between a study that describes what happened and one that establishes what the activation caused.
References for this section: 35 , 36 , 37 , 38 , 39 , 40 , 41 , 42 , 80 , 81 , 82 , 83 , 86 , 99 , 100 , 101 .
13 How to Calculate the Return
The six revenue streams an event produces, the inputs each requires, and the order in which to establish them.
This report has been about how to calculate return on investment for events. This section brings the findings of the preceding chapters together and shows how they combine into a single figure for an activation a brand is actually running.
The worked example is a national brand running an activation season across one sports property: four two-day deployments off a single build, at a total commitment of $1,000,000, reaching 16,000 participants. It extrapolates from the flagship package described by one interviewee, at $900,000 to $1,000,000 drawing between 1,000 and 6,000 people over two days. No participant in this research ran four deployments off one build, so the scenario is constructed rather than observed, and it is used here to demonstrate method rather than to report a result.
What the preceding sections establish
Section 03 finds that experimental work on product sampling traces measurable effects on purchasing as far as twelve months after the trial, which is the strongest behavioral evidence in the report.
Section 08 finds that an activation delivers an audience that is largely new to the brand and able to buy, and that several of the things it delivers are things a brand would otherwise purchase separately.
Section 09 finds that cost and attendance are known while conversion is not, so the calculation is better run backwards, dividing cost by attendance and customer value to produce the conversion rate an activation must achieve.
Section 10 finds that attendance and depth of engagement are not independent, and that beyond a certain volume additional throughput stops producing additional participation.
Section 11 finds that customer lifetime value determines the outcome more than any other input, and that it appeared in no account of how activations are commissioned.
Section 12 finds that the data required already exists and is discarded, that a formal study costs under two percent of a flagship budget, and that four in five captured contacts receive no follow-up at all.
Bringing them together
An activation produces six revenue streams at once. Each is measurable, each has a market price, and a brand holds the ability and in many cases the data to measure and use for all of them. Five of them substitute for spend the brand would otherwise commit to get the same outcome. The sixth is revenue from customers the activation produced.
They are realized at different points. Brand lift, product trial and research interaction are delivered the moment the activation runs. Retention contact and earned social accrue in the weeks afterward. Conversion revenue is earned by working the captured contacts, and it is the largest of the six and the only one that fails entirely if nobody follows up.
Connected end to end, the measurement chain converts a single activation budget into a return of between 1.4 and 4.5 times, depending on what a customer is worth.
| Stream | Basis | Discussed in | Per participant | At 16,000 |
|---|---|---|---|---|
| Brand lift | 40 percent lifted at $35 per lifted person | Section 08 | $14 | $224,000 |
| Product trial | Sampling program equivalent | Section 03 | $20 | $320,000 |
| Research interaction | Commissioned research equivalent | Section 12 | $15 | $240,000 |
| Customer retention | 20 percent existing customers at retention cost | Section 11 | $7 | $112,000 |
| Earned social | Organic posts at published creator rates | Section 08 | $1 | $16,000 |
| Conversion revenue | 60 percent capture, 2.5 percent conversion, $2,000 value | Section 09 | $30 | $480,000 |
| Total return | $87 | $1,392,000 |
One. Displaced spend
A displaced stream is marketing the brand would otherwise have bought and no longer needs to, because the activation delivered it. It is not new money coming in, it is money not going out. Five of the six streams work this way: brand lift, product trial, research interaction, customer retention and earned social. The sixth, conversion revenue, is money the business did not have before.
The displaced streams carry the result at lower customer values. Section 09 shows that conversion alone would need to reach 3.1 percent of participants to recover a $1,000,000 activation at a customer worth $2,000, and the 2.5 percent conversion assumed here amounts to 1.5 percent. Conversion alone does not clear the cost. All six together do, which is the difference between assessing an activation on one output and assessing it on all of them.
Formula: displaced spend
D = P × (L·m + t + r + e·k + s)
Where P participants · L share lifted · m cost per lifted person through media · t product trial value · r research value · e share who are existing customers · k retention cost per customer · s earned social value per participant.
Brand lift substitutes for targeted media at $35 per lifted person, product trial for a sampling program, direct interaction for commissioned research, and the presence of existing customers for retention activity, which Section 11 records as costing five to seven times less than acquisition, and attendee posts for paid creator content at published rates. A brand holds its own figure for all five.
At $57 per participant across five streams, 16,000 participants produce $912,000 before anybody converts. Retention is priced at $33 a customer, derived from the acquisition costs in Section 11 and the finding that retaining a customer costs five to seven times less than acquiring one. The calculation requires no assumption about behavior after the event, which makes it the firmest figure available and the right one to establish first.
One test applies. Displaced spend counts only where the brand would genuinely have committed it. A brand with no sampling program has displaced nothing on that line. Applying that test to the actual budget is what makes the figure defensible rather than aspirational.
Attendance is the lever. Activation cost is committed once while every stream accrues per head, so the number of deployments a single build serves raises the return more than the size of the budget does. Four deployments off one build produce four times the streams at the same committed cost.
Two. Conversion revenue
This is where the return is made.
An activation produces contacts a brand can reach afterward. Exhibition research puts two-thirds of them as prospects the brand has not previously reached and four-fifths as holding buying authority [ 74 ]. Published research finds that roughly 30 percent of consumers will share an email address with no incentive, rising to approximately 90 percent where an appropriate value exchange is offered [ 41 ].
Formula: conversion revenue
C = P × c × v × q
Where P participants · c contact capture rate · v conversion rate of captured contacts · q customer lifetime value.
At 16,000 participants, 60 percent capture, 2.5 percent conversion and a customer worth $2,000, that is $480,000 from 240 new customers. At a customer worth $15,000, the same rates produce $3,600,000. Customer lifetime value moves this stream further than any other input, and the brand already holds that calculation.
The Event ROI Model

Follow-up creates the revenue
The contact is created by the activation. The revenue is created by the follow-up. Without it this component returns nothing and the entire return collapses back to displaced spend.
Follow-up is also the only step in this section with no cost to recover. A formal study has to justify $7,500 to $15,000 and a holdout forfeits the activity held back, while an email costs cents against a contact the activation has already paid for. There is no conversion rate low enough to make it unprofitable.
Speed determines how much of the revenue remains reachable. Research published in Harvard Business Review found that firms contacting a lead within an hour were nearly seven times more likely to qualify it than those waiting a further hour, and more than sixty times more likely than those waiting a day, against an audited average response time of 42 hours and 23 percent who never responded at all [ 101 ]. Section 08 places the decay of an activation's effect at roughly half the affected group within three months. Follow-up is the only intervention that acts on the effect while it is still there.
Three decisions make it possible, and all three are taken before the activation runs. What will be captured and by whom. Who sends the follow-up and within what period. What the follow-up references, since the engagement data needed to make it specific rather than generic already exists wherever interactive technology is deployed.
Where an intermediary captures the contact and the brand converts it, the handover has to be agreed at commissioning. Section 06 describes what happens otherwise, which is that the contact is captured by one organization and actioned by none.
What an unworked contact costs
Multiply the contacts captured but never contacted by the cost per captured contact, then add the conversion revenue they would have produced. That is the return an activation generated and the brand did not collect.
On the industry's commonly cited rate of four in five receiving nothing, a flagship activation capturing 1,800 contacts leaves 1,440 unworked. At $528 a contact that is $760,000 of spend abandoned, and at 2.5 percent conversion and $2,000 customer value a further $72,000 of revenue forgone. Section 12 sets out the sourcing on that rate.
Three. Demonstrated return
The first two components produce a return figure. This one establishes how much of it the activation caused, which is the difference between a number a finance function will discuss and one it will accept.
Observed purchasing after an activation contains three parts. Acceleration, where existing customers buy earlier than they would have. Expansion, where people who would not have considered the brand buy. Cannibalization, where purchases replace ones that would have happened anyway. Only expansion is incremental, and separating them requires a comparison group.
Formula: incremental return
R inc = (D + C × i) ÷ A
Where i incremental share of conversion established by a holdout market or control group · A activation cost.
The cheapest comparison group costs nothing. Where an activation runs across several markets in a season, holding two comparable markets back and comparing commercial outcomes across activated and held-out markets produces the incremental share directly. The only cost is the activity foregone in the held-out markets, and the only requirement is that they are chosen for comparability rather than for being least promising.
Where a holdout is not available, a control-exposed brand lift study at $7,500 to $15,000 establishes the effect on brand metrics, and randomization matters more than sample construction. Across fifteen large advertising experiments covering 1.6 billion impressions, observational methods routinely failed to recover the causal effects the randomized versions established, and more often overstated effectiveness than understated it.
Applying a conservative incremental share of 60 percent to the conversion stream, the season returns $1,200,000 at a customer worth $2,000 and $3,072,000 at $15,000. Both remain above the committed cost.
The three components assembled
Formula: total return
R = (D + C) ÷ A
Where D displaced spend · C conversion revenue · A activation cost.
Every input is either held by the brand or established in the sections above. Nothing in the formula requires data the industry does not currently produce.
| Customer lifetime value | Displaced streams | Conversion revenue | Total return |
|---|---|---|---|
| $2,000 | $912,000 | $480,000 | 1.4x |
| $8,000 | $912,000 | $1,920,000 | 2.8x |
| $15,000 | $912,000 | $3,600,000 | 4.5x |
Two things carry the return. Attendance, because every stream accrues per head against a cost committed once, which is why deployments off a single build compound the result. And customer value, which moves the conversion stream further than any other input and is why the categories identified in Section 11 occupy the strongest positions.
The single recommendation
Connect the measurement chain as a continuous loop. Agree at commissioning what will be captured, who will hold it, who will act on it and against what commercial figure the result will be assessed. Assign accountability for the outcome to a named party, because no party assumes it by default and the information required sits in more than one organization.
The measurement gap in this category is an adoption problem rather than a technical one. The tools exist, the costs are small, and the evidence that the underlying effects are real is stronger than the industry generally claims. What is missing is the decision to connect what is already being measured to the commercial outcome it is meant to produce, and that decision has to be taken before anything is built.
The order to establish inputs
Each of the four steps below has to happen before a particular point, and the sequence is close to the reverse of current practice.
Establish customer lifetime value and calculate the breakeven conversion rate, before scoping. Section 09 shows the required rate varying by more than an order of magnitude according to customer value alone. Where the rate exceeds anything the organization has achieved, the scope should change rather than the assumption.
Establish displaced value per participant and the attendance required, before scoping. This determines how many deployments the build needs to serve.
Decide who follows up, how quickly, and with what, before the build. The capture mechanism, the handover and the response window all have to exist in the brief, because none can be added afterward.
Commission the comparison, before the season schedule is fixed. Holding markets back is free and cannot be arranged retrospectively.
Two conditions decide how far you get
The methods above are available to any brand in principle. In practice two things decide how far a given activation can go, and both practices are critical to get the biggest return and the most out of an event.
The first is whether identity is established. Where a brand knows who attended, the conversion component is available and the displaced component becomes precise rather than estimated. Where attendance is anonymous, displaced spend is the ceiling.
The second is whether anyone owns the outcome. Measurement happened in this research when the same organization both paid for the event and collected the sales from the event. That organization has a reason to find out whether the event worked, and it holds the figures to check. Measurement stopped when an agency commissioned the event for a brand, because the agency that ran it never sees the brand's sales, and the brand that sees them did not run the event. Where several organizations sit between the brand and the build, someone has to be made responsible for measurement at the start, because nobody takes it on unaided.
Both are decisions taken at commissioning, which is the practical finding of this report. If a brand is running an event, communicating the goals/objectives and who is responsible for not only capturing the data at all stages, plus who is accountable for the follow-up. is critical for event profitability.
References for this section: 41 , 74 , 101 .
Conclusion
What the research establishes, and what a brand should do with it.
Consumer demand for live experience is strong and growing. People are moving discretionary spending from goods toward things they do rather than things they own, the preference holds through price increases and strengthens under economic pressure, and property markets are changing shape around it. That much is settled by evidence gathered outside the events industry.
Events produce measurable effects. Attendance raises brand equity across every format tested. Physical presence outperforms mediated contact by a wide margin in controlled conditions. Roughly half of attendees report the effect persisting for months. The mechanisms are documented in the behavioral literature and they are not in dispute.
What has not been established is the link between those effects and revenue, and the reason is structural rather than technical. The party best placed to observe what happened inside an activation is a production or fabrication partner. The party holding the commercial outcome is the brand, two or three organizations removed. Across ten interviews, every participant could describe throughput and none could describe revenue. The chain is simply not joined.
A commissioning decision, not analytical
Nothing in this research suggests that measurement requires new technology. The interactive systems already deployed capture individual-level engagement data as a by-product of operating, and most of the data is simply not used. A formal study costs under two percent of a flagship budget. Follow-up costs cents against a contact the activation has already paid for and more importantly if contacted, has a high chance of purchasing something.
What these have in common is that all of them have to be decided before the event. Customer lifetime value and the breakeven conversion rate belong at scoping. Identity capture has to exist in the brief. Who follows up, how quickly and with what has to be agreed while the parties are still in the room building the strategy. Held-out markets have to be chosen before the season schedule is fixed. None of it can be arranged afterward, which is why measurement so often fails to happen despite costing so little.
The streams produce a readable return
An activation produces six revenue streams: brand lift, product trial, research interaction, customer retention, earned social, and conversion from captured contacts. Each substitutes for spend a brand would otherwise commit or produces revenue directly, each carries a market price, and a brand holds the inputs for all six streams. Section 13 sets out the arithmetic.
Two variables have the biggest impact. Attendance, because activation cost is committed once while every stream accrues per participant, which is why a single build serving several deployments compounds the return. And customer lifetime value, which moves the conversion stream further than any other input and determines which categories the economics support.
The figures in this report are modeled from published rates and stated assumptions, and every one of them is labeled. They are not a claim about what any particular activation returned. They are a demonstration that the calculation can be performed, by a brand, from figures it has access to, before it commits the budget for an event rather than after.
Appendix
Contributors, method, sourcing standard, known gaps and excluded material.
Interview method
Ten structured interviews were conducted between 9 and 23 July 2026, each running approximately forty minutes and following a common guide covering industry conditions, evaluation practice, specific deployments and outlook. Interviews were recorded and transcribed. Participants were informed that quotations might be published and that they would review any quotation credited to them before publication.
Contributors
| Contributor | Position | Perspective |
|---|---|---|
| Tony Croslin | Director of Experiential and Brand Consulting, Elevate | Agency, sports and entertainment |
| Vernon Walker Jr. | Director, Sponsorship Consulting, MKTG Sports & Entertainment | Agency, formerly league office |
| Le Tate | Owner, T8 Exhibits | Custom fabrication |
| Virginia Lewis | Agency, Account Development & Solutions | Agency, digital and retail |
| Confidential | Senior Leader Business Association | Direct client, association conference |
| Nora Brindle | Manager/Producer, Live Events, Solomon Group | Agency, collegiate fan events |
| Confidential | Events Manager | National Manufacturer |
| Scott Schoeneberger | Bluewater Technologies Group | Production agency leadership |
| BJ Mazmanian | Bluewater Technologies Group | Production agency leadership |
| Andy Makins | Bluewater Technologies Group | Production agency business development |
Sourcing standard
Figures in this report fall into five categories. Observed figures were recorded directly from a live deployment. Interview figures were stated by a named participant and published with their approval. Practitioner figures were given in interview but published without naming the source where they relate to a third party's commercial arrangements. Benchmark figures are drawn from third-party research traced to a named primary source. Illustrative figures are modeled assumptions shown to demonstrate method and identified as such wherever they appear.
Numbered references appear in square brackets throughout the text and correspond to the list at the end of this appendix. Each section also carries a reference note listing every source drawn on in that section. Entries marked for confirmation have been identified but not yet verified against the primary document, and are flagged rather than presented as settled.
Known gaps
- No source across ten interviews supplied a conversion rate from attendee to customer.
- No source supplied an average customer lifetime value. Breakeven is reported instead.
- Dwell time was not measured by any participant and remains unquantified throughout.
- Retail and healthcare deployments are not represented in the interview base.
- Final cost figures for the permanent installation are pending and will replace the working assumption used in Section 08.
- Media reach reported for that installation requires methodology review before use, and is discussed qualitatively rather than numerically.
- Quotations remain subject to participant approval.
Considered and excluded
Five figures or frameworks were identified during this research, considered, and excluded. They are recorded here because the exclusions form part of the method.
These are not isolated cases. Compilations of experiential marketing statistics in general circulation routinely credit figures to organizations that cannot be shown to have published them, present the same measure at incompatible values, and carry market sizing that contradicts itself between adjacent sections. Where a figure could not be traced to a named source with a disclosed method, it has been excluded from this report regardless of how well it supported the argument.
- Claim that experientially acquired customers show 20 to 40 percent higher lifetime value. Traced to an uncited marketing page with no primary research behind it. Neighboring aggregators cite the same claim at 20 percent, at two times, at three times and at 52 percent, credited to sources that cannot be traced.
- Market sizing figure for youth sports generated by an artificial intelligence assistant during an interview and identified as such by the participant.
- Claim that business meeting attendance will rise 69 percent by 2026. Uncited and implausible.
- Claim crediting a digital banking acquisition cost of $2,140 to a study of 1,840 fintech companies, and a survey of 3,200 companies with combined budgets above $74 billion. Neither source can be traced.
- Learning-styles theory as a rationale for participatory experience design. The hypothesis has been repeatedly tested and does not hold.
References
Numbered sources cited throughout the report.
- 1. Pine, B.J. II and Gilmore, J.H. (1998). Welcome to the Experience Economy. Harvard Business Review, 76(4), 97-105.
- 2. Pine, B.J. II and Gilmore, J.H. (1999). The Experience Economy: Work Is Theatre and Every Business a Stage. Harvard Business School Press.
- 3. Schmitt, B. (1999). Experiential Marketing. Journal of Marketing Management, 15(1 to 3), 53-67.
- 4. Holbrook, M.B. and Hirschman, E.C. (1982). The Experiential Aspects of Consumption: Consumer Fantasies, Feelings, and Fun. Journal of Consumer Research, 9(2), 132-140.
- 5. Brakus, J.J., Schmitt, B.H. and Zarantonello, L. (2009). Brand Experience: What Is It? How Is It Measured? Does It Affect Loyalty? Journal of Marketing, 73(3), 52-68.
- 6. Fredrickson, B.L. and Kahneman, D. (1993). Duration Neglect in Retrospective Evaluations of Affective Episodes. Journal of Personality and Social Psychology, 65(1), 45-55.
- 7. Kahneman, D., Fredrickson, B.L., Schreiber, C.A. and Redelmeier, D.A. (1993). When More Pain Is Preferred to Less: Adding a Better End. Psychological Science, 4(6), 401-405.
- 8. Redelmeier, D.A. and Kahneman, D. (1996). Patients' memories of painful medical treatments. Pain, 66(1), 3-8.
- 9. Alaybek, B., Reeshad, S., Dalal, S.F., et al. (2022). All's well that ends (and peaks) well? A meta-analysis of the peak-end rule and duration neglect. Organizational Behavior and Human Decision Processes, 170.
- 10. Krishna, A. (2012). An integrative review of sensory marketing: Engaging the senses to affect perception, judgment and behavior. Journal of Consumer Psychology, 22(3), 332-351.
- 11. Krishna, A., Lwin, M.O. and Morrin, M. (2010). Product Scent and Memory. Journal of Consumer Research, 37(1), 57-72.
- 12. Elder, R.S. and Krishna, A. (2010). The Effects of Advertising Copy on Sensory Thoughts and Perceived Taste. Journal of Consumer Research, 36(5), 748-756.
- 13. Bawa, K. and Shoemaker, R. (2004). The Effects of Free Sample Promotions on Incremental Brand Sales. Marketing Science, 23(3), 345-363.
- 14. Kim, Y., Lee, H.-W., Magnusen, M. & Kim, M. (2015). Factors Influencing Sponsorship Effectiveness: A Meta-Analytic Review and Research Synthesis. Journal of Sport Management, 29(4), 408-425.
- 15. Lin, H. C., Bruning, P. F., Lao, C. W., & Shao, J. (2026). Quality and Intention Signaling: A Meta-Analysis of How Sponsorship Relates to Consumer Responses According to Content, Observability, Credibility, and National Culture. Journal of Advertising , 55 (2), 136–155.
- 16. Chen, B., Shi, Z. The impact of sports event brand experience on spectator loyalty: mediating roles of attitude and subjective norms. Scientific Reports, 15, 30771.
- 17. Hsiao, C.H., Tang, K.Y. and Su, Y.S. (2021). An Empirical Exploration of Sports Sponsorship: Activation of Experiential Marketing, Sponsorship Satisfaction, Brand Equity, and Purchase Intention. Frontiers in Psychology, 12, 677137.
- 18. Binet, L. and Field, P. (2013). The Long and the Short of It: Balancing Short and Long-Term Marketing Strategies. Institute of Practitioners in Advertising.
- 19. Sharp, B. (2010). How Brands Grow: What Marketers Don't Know . Oxford University Press.
- 20. Sharp, B. (2022). Keynote address, Mi3-LinkedIn B2B Next Summit, Sydney, August 2022. Remarks reported in Mi3, 23 August 2022. No transcript or published paper exists; audio released by Mi3 was subsequently withdrawn at the request of the Ehrenberg-Bass Institute.
- 21. Hansen, K. (2004). Measuring performance at trade shows: Scale development and validation. Journal of Business Research, 57(1), 1-13.
- 22. Gopalakrishna, S. and Lilien, G.L. (1995). A Three-Stage Model of Industrial Trade Show Performance. Marketing Science, 14(1), 22-42.
- 23. AMEC (2020). The Barcelona Principles 3.0. International Association for the Measurement and Evaluation of Communication.
- 24. Machleit, K.A., Eroglu, S.A. and Mantel, S.P. (2000). Perceived Retail Crowding and Shopping Satisfaction: What Modifies This Relationship? Journal of Consumer Psychology, 9(1), 29-42.
- 25. Eroglu, S.A., Machleit, K.A. and Barr, T.F. (2005). Perceived retail crowding and shopping satisfaction: the role of shopping values. Journal of Business Research, 58(8), 1146-1153.
- 26. Hui, M.K. and Bateson, J.E.G. (1991). Perceived Control and the Effects of Crowding and Consumer Choice on the Service Experience. Journal of Consumer Research, 18(2), 174-184.
- 27. You, Y., Vadakkepatt, G.G. and Joshi, A.M. (2015). A Meta-Analysis of Electronic Word-of-Mouth Elasticity. Journal of Marketing, 79(2), 19-39.
- 28. Babic Rosario, A., Sotgiu, F., De Valck, K. and Bijmolt, T.H.A. (2016). The Effect of Electronic Word of Mouth on Sales: A Meta-Analytic Review. Journal of Marketing Research, 53(3), 297-318.
- 29. Trusov, M., Bucklin, R.E. and Pauwels, K. (2009). Effects of Word-of-Mouth Versus Traditional Marketing. Journal of Marketing, 73(5), 90-102.
- 30. Gupta, S., Lehmann, D.R. and Stuart, J.A. (2004). Valuing Customers. Journal of Marketing Research, 41(1), 7-18.
- 31. Gupta, S. and Lehmann, D.R. (2003). Customers as Assets. Journal of Interactive Marketing, 17(1), 9-24.
- 32. Gupta, S. and colleagues (2006). Modeling Customer Lifetime Value. Journal of Service Research, 9(2), 139-155.
- 33. Datta, H., Foubert, B. and van Heerde, H.J. (2015). The Challenge of Retaining Customers Acquired with Free Trials. Journal of Marketing Research, 52(2), 217-234.
- 34. Villanueva, J., Yoo, S. and Hanssens, D.M. (2008). The Impact of Marketing-Induced Versus Word-of-Mouth Customer Acquisition on Customer Equity Growth. Journal of Marketing Research, 45(1), 48-59.
- 35. Gordon, B.R., Zettelmeyer, F., Bhargava, N. and Chapsky, D. (2019). A Comparison of Approaches to Advertising Measurement: Evidence from Big Field Experiments at Facebook. Marketing Science, 38(2), 193-225.
- 36. Gordon, B.R., Moakler, R. and Zettelmeyer, F. (2026). Predicted Incrementality by Experimentation for Ad Measurement. NBER Working Paper 35044.
- 37. Lewis, R.A. and Rao, J.M. (2015). The Unfavorable Economics of Measuring the Returns to Advertising. Quarterly Journal of Economics, 130(4), 1941-1973.
- 38. Johnson, G.A., Lewis, R.A. and Nubbemeyer, E.I. (2017). Ghost Ads: Improving the Economics of Measuring Online Ad Effectiveness. Journal of Marketing Research, 54(6), 867-884.
- 39. Blake, T., Nosko, C. and Tadelis, S. (2015). Consumer Heterogeneity and Paid Search Effectiveness: A Large-Scale Field Experiment. Econometrica, 83(1), 155-174.
- 40. Phelps, J., Nowak, G. and Ferrell, E. (2000). Privacy Concerns and Consumer Willingness to Provide Personal Information. Journal of Public Policy and Marketing, 19(1), 27-41.
- 41. Boston Consulting Group and Google (2022). Consumers Want Data Privacy and Marketers Can Deliver.
- 42. Merkle (2022). Q1 2022 Customer Engagement Report. Survey of 2,000 United States consumers.
- 43. PQ Media (2026). Global Experiential Marketing Forecast 2026. https://www.pqmedia.com/product/global-experiential-marketing-forecast-2022-2026/
- 44. Mordor Intelligence (2026). Sports Sponsorship Market Size and Share Analysis, 2026 to 2030. https://www.mordorintelligence.com/industry-reports/sports-sponsorship-market
- 45. Center for Exhibition Industry Research (2026). CEIR Index Report.
- 46. Center for Exhibition Industry Research (2025). CEIR Index quarterly report, Q3 2025.
- 47. UFI, The Global Association of the Exhibition Industry (2026). Global Exhibition Barometer, 37th edition, July 2026.
- 48. UFI (2026). Global Exhibition Barometer, 36th edition, January 2026.
- 49. UFI and Oxford Economics (2026). Global Economic Impact of Exhibitions.
- 50. Northstar Meetings Group (2026). Meetings industry planner outlook survey, 2026. https://www.northstarmeetingsgroup.com/News/Industry/Meetings-and-Events-Industry-Forecast-2026
- 51. The Exhibitor Advocate, Tradeshow Logic and EVOLIO Marketing (2025). Annual Survey of Exhibition Rates.
- 52. The Exhibitor Advocate and EVOLIO Marketing (2025). The Evolving Landscape of Event Marketing.
- 53. EXHIBITOR Magazine. Trade show cost framework: total show cost as a multiple of exhibit space.
- 54. IEG. Sponsorship activation spend relative to rights fee.
- 55. United States Bureau of Labor Statistics (2025). Consumer Price Index, annual figure.
- 56. IBISWorld (2026). Pop-Up Stores and Temporary Retail in the United States.
- 57. Published trade coverage of South by Southwest brand activations, 2024 to 2026.
- 57a. BizBash (2026). SXSW 2026: Top brand events and activations. https://www.bizbash.com/experiential-marketing/sxsw-2026-top-brand-events-and-activations
- 57b. Event Marketer (2026). SXSW 2026: 18 experiential ideas and themes worth stealing. https://www.eventmarketer.com/article/sxsw-experiential-ideas-themes-worth-stealing/
- 57c. BizBash (2025). SXSW 2025: Top events and activations. https://www.bizbash.com/experiential-marketing/sxsw-2025-see-inside-top-events-and-activations-from-amazon-youtube-uber-and-more
- 58. Event Marketer (2025). SXSW 2026: Insights on an evolving brand activation landscape. https://www.eventmarketer.com/article/insights-sxsw-evolving-brand-landscape-2026/
- 59. McKinsey and Company (2026). The State of the Consumer 2026.
- 60. Live Nation Entertainment, Inc. (2026). Second Quarter 2026 Results, 31 July 2026.
- 61. Bank of America Institute (2026). Consumer spending analysis on live entertainment and sport, from aggregated card transaction data.
- 62. Morning Consult (2026). Consumer spending and experience preference tracking.
- 63. RetailMeNot (2025). Holiday shopping intent survey.
- 64. American Automobile Association (2025). Holiday travel forecast.
- 65. Freeman (2025). Attendee Intent and Behavior research series.
- 66. Event Marketer (2026). EventTrack 2026, produced in partnership with Sparks. Over 1,000 marketers and event attendees.
- 67. Event Marketer. EventTrack annual benchmark study, prior editions. The study has been conducted annually for more than a decade.
- 68. Hilton (2026). Meetings and events research on attendee motivation.
- 69. Global Business Travel Association (2025). Business travel cost and volume outlook.
- 70. Event Tech Live (2026). Return on attendance: The hidden crisis threatening a $1.5 trillion industry. https://eventtechlive.com/return-on-attendance-the-hidden-crisis-threatening-a-1-5-trillion-industry/
- 70b. Pheedloop (2026). Event Data Lab Report 06: Does easier registration lead to more no-shows? https://web.pheedloop.com/blog/event-data-lab-report-06
- 71. Published 2026 CPM benchmark compilations for connected television, digital video, display and out-of-home, drawing on EMARKETER, IAB, Magna, Tatari, FreeWheel, Skai and Tinuiti.
- 72. Out of Home Advertising Association of America. Format-level CPM benchmarks.
- 73. Influencer Marketing Hub (2026). Nano influencer rates: A complete cost guide for brands. https://influencermarketinghub.com/influencer-rates/nano-influencer-rates/
- 73b. Influencer Marketing Hub (2026). Micro influencer rates for 2026: A complete cost guide for brands. https://influencermarketinghub.com/influencer-rates/micro-influencer-rates/
- 74. Center for Exhibition Industry Research. Attendee purchasing authority, lead conversion and purchase decision timeframes. https://www.iaee.com/ceir/research/
- 75. Business-to-business event pipeline analysis (2025).
- 76. First Page Sage (2026). Customer acquisition cost benchmarks by industry.
- 77. American Bankers Association. Estimate of the cost of acquiring a new deposit account. (2026).
- 78. Fintel Connect (2025). Financial services customer acquisition benchmarking guide. https://www.fintelconnect.com/guides/cost-per-acquisition-benchmark-guide-for-financial-sector/
- 79. Lewis, M. Fan lifetime value. In Sports Analytics and Data Science . Springer Nature. https://link.springer.com/content/pdf/10.1007/978-3-031-65925-6_7
- 80. Nielsen. Brand Effect and Brand Lift study pricing.
- 81. Forrester Consulting. Total Economic Impact study on measurement workflow costs.
- 82. Center for Exhibition Industry Research. Pre-show marketing investment and outcome attainment.
- 83. Strategiwave (2026). Ten structured interviews conducted between 9 and 23 July 2026 across agency, fabrication, direct client and production agency roles.
- 84. Permanent installation reporting (2024). Nine-month deployment: visitor, throughput, media and staff feedback data.
- 85. Annual membership conference data (2026). Attendance, cost, retention and survey ranking data held by the operating organization.
- 86. Freeman and The Harris Poll (2025). 2025 Freeman Trust Report. Second in a three-part series; survey of United States event decision makers and working professionals.
- 87. Freeman and The Harris Poll (2025). The ROI of Relationships: Building a Cycle of Success. Third in the same series.
- 88. VML (2026). The Future 100: 2026. Twelfth edition. Collected by SONAR, VML's research practice, September to November 2025, across 16 markets and approximately 15,600 respondents.
- 89. The Harris Poll and Quad (2026). Research on in-person retail connection, February 2026.
- 90. Zarantonello, L. and Schmitt, B.H. (2013). The impact of event marketing on brand equity: the mediating roles of brand experience and brand attitude. International Journal of Advertising, 32(2), 255 to 280. Field study across trade shows, street events, pop-up shops and sponsored events.
- 91. Kwon, Y. and Cornwell, T.B. (2021). Sport sponsorship announcement and stock returns: a meta-analytic review. International Journal of Sports Marketing and Sponsorship, 22(1). Meta-analysis of 3,192 announcements across 36 studies and 41 samples.
- 92. Peck, J. and Shu, S.B. (2009). The Effect of Mere Touch on Perceived Ownership. Journal of Consumer Research, 36(3), 434 to 447.
- 93. Roghanizad, M.M. and Bohns, V.K. (2017). Ask in person: You're less persuasive than you think over email. Journal of Experimental Social Psychology, 69, 223 to 226.
- 94. Roghanizad, M.M. and Bohns, V.K. (2022). Should I Ask Over Zoom, Phone, Email, or In-Person? Communication Channel and Predicted Versus Actual Compliance. Social Psychological and Personality Science, 13(7).
- 95. Binet, L. and Field, P. (2007). Marketing in the Era of Accountability. Institute of Practitioners in Advertising. Analysis of 880 IPA Databank case studies.
- 96. Keller, K.L. (1993). Conceptualizing, Measuring, and Managing Customer-Based Brand Equity. Journal of Marketing, 57(1), 1 to 22.
- 97. Krishna, A. and colleagues (2024). A review of touch research in consumer psychology. Journal of Consumer Psychology.
- 98. Reb, J. and Connolly, T. (2007). Possession, feelings of ownership and the endowment effect. Judgment and Decision Making, 2(2), 107-114.
- 99. Google Ads Help. Understand Lift measurement statuses and metrics in Google Ads. Definition of cost per lifted user.
- 100. Meta Business Help Centre. About cost per brand lift in Facebook-managed brand lift tests. Definition of cost per brand lift.
- 101. Oldroyd, J.B., McElheran, K. and Elkington, D. (2011). The Short Life of Online Sales Leads. Harvard Business Review 89(3).
- 102. Kolsarici, C., Vakratsas, D. and Naik, P.A. (2020). The Anatomy of the Advertising Budget Decision: How Analytics and Heuristics Drive Sales Performance. Journal of Marketing Research 57(3), 468-488.
- 103. Steenkamp, J.-B.E.M., Nijs, V.R., Hanssens, D.M. and Dekimpe, M.G. (2005). Competitive Reactions to Advertising and Promotion Attacks. Marketing Science 24(1), 35-54.
- 104. Cobbs, J. (2011). Legal battles for sponsorship exclusivity: The cases of the World Cup and NASCAR. Sport Management Review.
- 105. Copeland, R., Frisby, W. and McCarville, R. (1996). Understanding the sport sponsorship process from a corporate perspective. Journal of Sport Management 10, 32-48.
- 106. Pine, B.J. and Gilmore, J.H. (1998). Welcome to the Experience Economy. Harvard Business Review , 76(4), 97–105.
- 107. Digiday (2026). Reporting on the growth of creator economy presence at Cannes Lions.
- 108. Ad Age (2025). Cannes Lions 2024 activation costs and the measurement of return. Cost tiers drawn from a sales deck and interviews.
- 109. Digiday (2025). Cannes Lions daily briefing series, 2025 festival.
- 110. Digiday (2026). Reporting on the growth of a holding company beachside activation into a standalone business unit.
- 111. Digiday (2026). Cannes Lions daily briefing series, 2026 festival.
- 112. Berne, C. and Garcia-Uceda, M.E. (2008). Criteria involved in evaluation of trade shows to visit. Industrial Marketing Management, 37(5), 565 to 579.
- 113. Han, H. and Verma, R. (2014). Why Attend Tradeshows? A Comparison of Exhibitor and Attendee’s Preferences. Cornell Hospitality Quarterly, 55(3), 239 to 251.
- 114. Oppermann, M. and Chon, K.-S. (1997). Convention Participation Decision-Making Process. Annals of Tourism Research, 24(1), 178 to 191.
- 115. Zhang, H.Q., Leung, V. and Qu, H. (2007). A refined model of factors affecting convention participation decision-making. Tourism Management, 28(4), 1123 to 1127.
- 116. Mair, J. and Thompson, K. (2009). The UK association conference attendance decision-making process. Tourism Management, 30(3), 400 to 409.
- 117. Incentive Research Foundation (2024). 2024 Incentive Travel Index. Industry-sponsored.
- 118. Incentive Research Foundation (2024). 2024 Attendee Preferences for Incentive Travel: How the Right Destinations and Good Program Design Boost Employee Motivation. Fourth annual wave. Industry-sponsored.
- 119. Forrester (2025). Events Are Under Pressure: Six Findings From Forrester’s Q1 2025 State Of B2B Events Survey. More than 250 event decision makers.
- 120. Forrester (2026). The Next Era Of B2B Events: Eight Data-Backed Shifts Defining 2026. Findings from Forrester’s Q1 2026 State Of B2B Events Survey. More than 400 event decision makers globally.